
VISTA Variables in the Via Lactea Survey - Data Release 1
Provided by: D. Minniti, P. Lucas, and the VVV team
Release Date: 25.07.2011
Summary
The VVV Survey data delivered in this ESO Data Release 1 (DR1) includes the VISTA paw-print and tile images that were acquired until September 30, 2010, and processed by the Cambridge Astronomical Survey Unit (CASU). These CASU v1.1 data files were successfully submitted to the ESO Archive through the Phase 3 system before April 30, 2011.
The Phase 3 release contains observations up to 30 September 2010 with all the approved data from CASU v1.1 pipeline reduction, including images and merged source catalogs. The list for this first Phase 3 DR1 has ~2800 tile images. If we count these plus associated confidence maps and catalogues they are approximately 1.6TB of data.
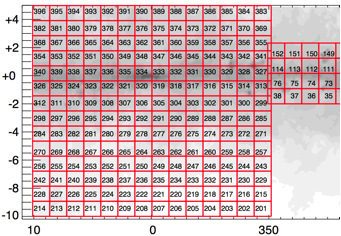
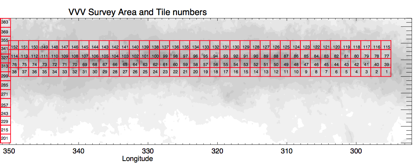
Figure 1. Maps showing the VVV tile numbers for: (a) bulge; and (b) disk.
VVV Tiles
The VVV photometry is divided into different disk and bulge tiles. The tile nomenclature goes from d001 to d152 in the disk, and from b201 to b396 in the bulge. The map with the field IDs is shown in Figures 1a and 1b, overlapped on the extinction map of the inner Milky Way from Schlegel et al. 1997.
The VVV Survey Year 1 data completion is illustrated in Figures 2-4. The files for this VVV Survey DR1 include images and their respective photometric catalogues that have passed the Quality Control (QC), ie not all the fields shown in Figures 2-4 are being included in DR1, only higher quality data. For the Phase 3 DR1 of Year 1 we defined the list of data files that pass all the quality and calibration checks in order to be released, and at the same time defined a list of deprecated images, or re-reduced/re-calibrated some acceptable files. The final list of tiles available can be found in the attached document vvv_DR1_list.pdf.
Bulge:
JHKs: 176 out of 196 fields completed = 90% (in all three filters)
YZ: 78 out of 196 = 40% (in both filters)
VAR: 113 out of 5x 196 (980) = 12% OBs completed
Disk:
JHKs: 152 out of 152 fields completed = 100% (in all three filters)
YZ : 128 out of 152 = 84% (in both filters)
VAR: 547 out of 5x 152 (760) = 72% OBs completed
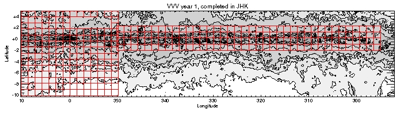
Fig. 2. VVV Survey observations completed in JHKs until Oct 26th, 2010. These OBs were given the highest priority, and the multi-color map of the VVV survey region is almost complete.
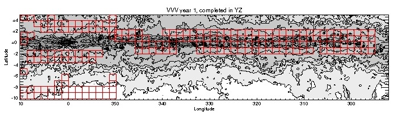
Fig. 3. VVV Survey observations completed in ZY until Oct 26th, 2010. These ZY filter observations were given slightly lower priority than the JHKs maps. However, we obtained significant coverage, specially in the disk region. These filters are essential to complement and interpret the information provided by the JHKs maps: they can lift the degeneracy or ambiguity of the JHKs color-color diagrams and color-magnitude diagram in the presence of large and variable interstellar extinction.
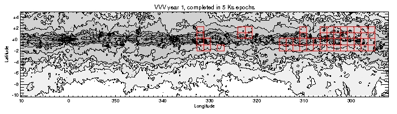
Fig. 4. VVV Survey observations completed in 5 Ks epochs until Oct 26th, 2010. These Ks observations of the first year were intended to test the variability search techniques, and to provide a long term baseline for stellar variability (e.g. microlensing, long term variable sources), as well as for proper motions. We decided to give them lower priority than the multi-color maps, and it is evident that the total coverage is rather poor due to the time lost to telescope intervention and weather.
There are still observations pending from YEAR 1, as shown below in the maps of ZY filter observations and 5 Ks filter observations (credit M. Hempel). These show completed tiles, but there are still pending observations. In addition to the two YZ and Ks variability maps, the map of JHKs is mostly completed, but with 20 tiles still queued for observations. The total completion is 52% in terms of OBs, and 69% in terms of time for the first year observations.
The adopted naming convention for the 3 types of files of this release is the following:
| Tile images | *_st_tl.fits.fz |
| Associated weight map | *_st_tl_conf.fits.fz |
| Source lists per tile | *_st_tl_cat.fits |
Also, the OBJECT keyword identifies the VVV tile ID, as shown in Figures 1 a and b.
Quality Control
The data processing pipeline at CASU released in May 2010 the version 0.8, which was very reasonable, and in September 2010 the version 1.0, which was very good, and can be publication quality after proper checks are made. The DR1 is based on the new CASU version v1.1, and the team has worked on the quality control using the v1.1 data, as detailed below. However, the v1.0 and v1.1 tiles are identical as far as the FITS image extensions are concerned. The differences are only in the image headers and the catalogues.
Visual Quality Control was performed in different steps. Initially this was done using the JPEG images of the individual pawprints supplied by CASU before August 2010. The JPEG images are not ideal because they look too small when displaying whole tiles (or too big when zoomed in). Then, visual Quality control of VVV tiles was made on a fraction of the FITS images supplied by CASU version 1.0. Finally, there was inspection of the v1.1 tiles supplied by CASU. A word of caution: this intense activity is continuing, and even though we checked the images for gross defects, we are still identifying images that need to be reprocessed or reacquired.
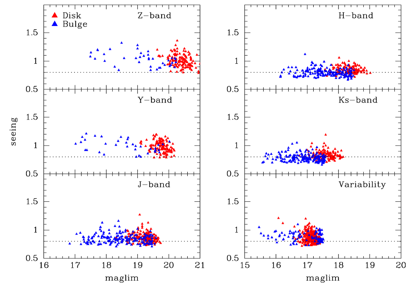
The Quality Control for the Phase 3 data from v1.1 was performed on the paw-prints with involvement of most of the scientists from the team. We checked image defects, telescope problems, seeing, zero points, magnitude limits, ellipticities, airmass, etc. There are a number of well known image defects intrinsic to VISTA, many of which are illustrated with pictures in the CASU and VVV web pages (see also vvv_defects.pdf).
Algorithmic quality control cuts to remove images with low zero points (after correcting for the seasonal trend), seeing that was significantly outside specification, or high average ellipticity were also applied. These were based on the v1.0 reduction, but no significant changes are expected in the v1.1 data.
VVV Calibrations
First we explain how to calculate source magnitudes from the fluxes in the catalogues and the zero points and other keywords in the catalogue headers. The main equation is
calMag = instMag + ZP + atmCor + texpCor - apcor
where the terms on the right hand side are defined below, and there is a choice of many apertures for instMag and apcor. apcor1 is a 1 arcsec diameter and consecutive apertures increase in diameter by a factor of sqrt(2), so that apcor3 is a 2 arcsec diameter aperture, and we take texpCor from the DIT keyword.
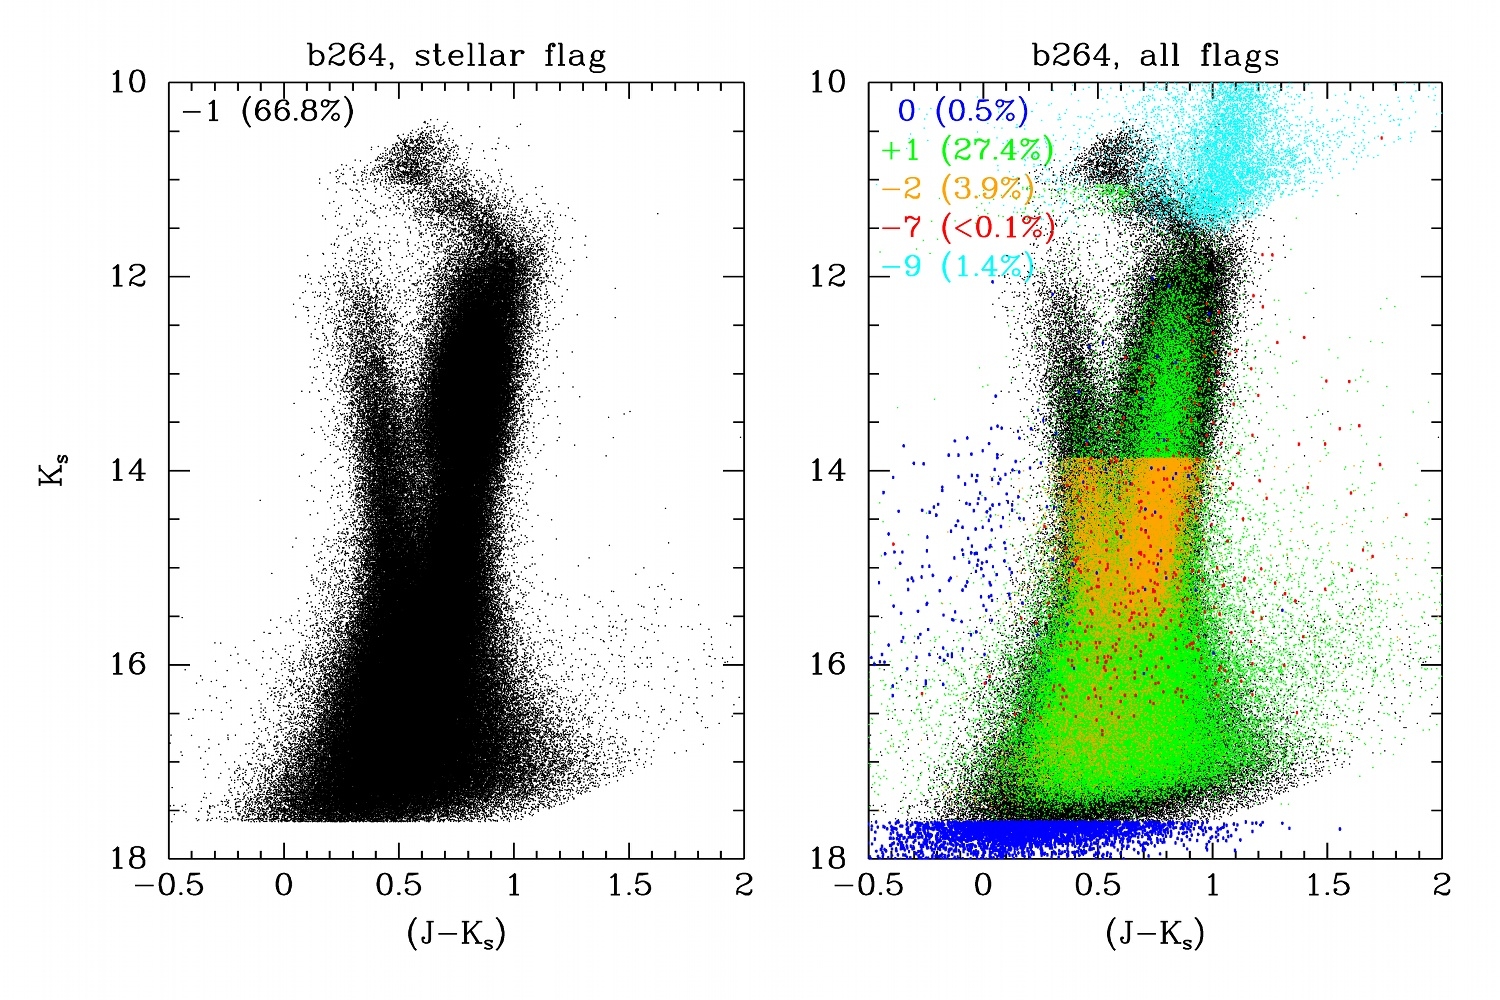
The photometry of every source in the catalogs is labelled with a morphological classification flag: -1 "stellar", +1 "non–stellar", 0 "noise", -2 "borderline stellar", -7 "extended sources" (now changed to -3), and -9 "saturated stars". The flags are listed in detail in the CASU webpages. Figure 5 shows an example of the various flags. For most purposes it is recommended to use only sources with flag -1, corresponding to stellar sources, which have the highest quality and account for about 2/3 of all sources on average.
In addition, the calibration was investigated as function of crowding in the bulge and disk fields, using the overlap regions between some consecutive tiles. For example, the overlapping region between two tiles (b237 and b251 in this case) has 0.172 deg2, and using only sources with -1 flag and 2 arcsec as max separation, a total of 21720 stars were matched, and the agreement is excellent, with no significant trends with magnitude.
We are finding differences of up to 0.1 mag in some of the photometric calibrations of the disk and bulge fields with respect to 2MASS, which are not surprising. We note that eventually in these regions the VVV would be better calibrated and more homogeneous than 2MASS, because "The 2MASS Survey has no Level 1 Specifications in the Galactic Plane with regard to completeness, reliability, and photometric accuracy".
We would like to issue proper warnings about the specific version v1.1 released. For example, the data of this first release are well calibrated nightly and agree with 2MASS by design (in the cases that it does not we suspect that 2MASS is the problem). In addition, 2MASS and VVV should not exactly agree because filter profiles are different, and the transforms for this v1.1 are provided below.
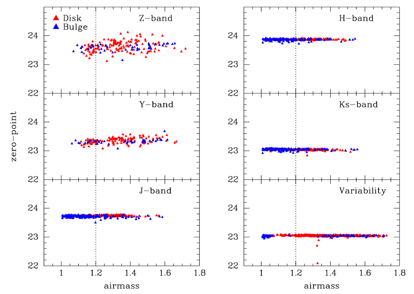
Looking at the zeropoints, we include the J, H and Ks tiles in the release that are within 0.1 mag of the average (after correcting for the seasonal trend with time). However, the Z and Y calibrations are still imperfect, with their ZPs showing more scatter and in some cases 0.1 mag below the trends. The full global quality checks must wait for the future releases where we can use the overlap regions for every tile, and use sql searches to pick the regions with strange color-magnitude diagrams. Internally the photometry has enough counts to guarantee small scattering errors (~0.01 mag), but the external calibration in ZY is much more uncertain.
Note that even though the photometric and astrometric calibration is all done relative to 2MASS, with greater uncertainty in the Z and Y bands, the accuracy of these calibrations are field dependent (e.g. more uncertain in more crowded fields). In addition, the limiting magnitude achieved is different depending on the fields, and a deeper photometry could be achieved using other photometric techniques.
As an independent check, the photometry in overlapping regions of some tiles has been compared. These tests have confirmed that the 2MASS-based calibration strategy generally works well, and that the CASU photometry is accurate down to the limiting magnitudes for all filters, with larger scatter in the ZY filters.
The VVV saturation limit is typically Ks = 10 mag, but in high density fields like the in the Galactic center region it can be Ks=11 mag. For brighter magnitudes the 2MASS photometry should be preferred. The photometric limit is typically Ks=17.5, but in high density fields like the in the Galactic center region it can be Ks<16 mag (see FITS header keywords like ABMAGLIM, ABMAGSAT, etc). We note that PHOTZPERR=0.01 for most tiles, and this is due to the large number of calibrators (stddev/sqrt(N)) so it reflects internal consistency rather than accuracy. More realistic estimates of external errors will be provided in future releases when the complete data are available.
The photometric catalogues of this first Data Release contain calibrated aperture photometry, and the limiting magnitudes correspond to the aperture photometry. For some specific scientific purposes it would be more convenient to obtain psf photometry, or differential image photometry on the processed paw-print images, which can give better and deeper photometry in the most crowded regions.
The photometric calibration with respect to 2MASS includes an empirically derived extinction term in the transformation equations. While the details are available at CASU, we summarize the procedure below.
CASU has derived photometric transformation equations that are valid for blue dwarf stars with 0<(J-Ks)<1 and zero extinction. These define the VISTA/VIRCAM Vega-based photometric system. There is no set of equations that converts 2MASS magnitudes to VISTA magnitudes for stars in VVV because most stars have a significant but unknown amount of reddening due to interstellar extinction. Extinction cannot be corrected for unless the spectral type is known. Also, a large fraction of VVV sources are giant stars, which are not covered by the existing CASU transformations.
CASU has empirically derived interstellar extinction-dependent modifications to their standard equations that allow zero points to be calculated for VVV fields. Zero points are defined at the zenith. The extinction toward each star is taken as the value given by the Bonifacio, Monai & Beers (2000) correction to the Schlegel et al. (1998) extinction map values i.e.
E(B-V)' = 0.1 + 0.65*(E(B-V)-0.1), for E(B-V)>0.1
E(B-V)' = E(B-V), for E(B-V)<=0.1
where E(B-V) is computed using bilinear interpolation from the 4 nearest Schlegel map pixels. Then the extinction term
Extcor = max(2.5, E(B-V)')
is defined for use in calculating zero points. Extcor is an empirical parameter that does not relate to the interstellar extinction derived by optical or infrared photometry of individual stars because E(B-V)' represents the full column of extinction through the Galactic plane as measured by the COBE satellite.
This follows the procedures described in Hodgkin et al.(2009, MNRAS 394, 675) for UKIRT Wide Field Camera observations. VVV zero points are derived using 2MASS stars which satisfy 0<(J-Ks)<2, 0<(J-Ks)dr<1 are not saturated and have magerr<0.1, class=-1, ellipticity<0.5. Here "dr" denotes dereddened (J-Ks) colour determined using the Extcor term defined above and a standard reddening law.
VVV zero points are then calculated using the equations below. Median values are computed for each array, and these are then used to compute a zero point for each tile.
ZPZ = (Z2M +1.025*(J-H)2M +0.37*Extcor) -instmag -atmCor -texpCor +apcor
ZPY = (Y2M +0.610*(J-H)2M +0.14*Extcor) -instmag -atmCor -texpCor +apcor
ZPJ = (J2M -0.077*(J-H)2M +0.010*Extcor) -instmag -atmCor -texpCor +apcor
ZPH = (H2M +0.032*(J-H)2M +0.015*Extcor) -instmag -atmCor -texpCor +apcor
ZPKs = (Ks2M +0.010*(J-Ks)2M +0.005*Extcor) -instmag -atmCor -texpCor +apcor
where "2M" denotes 2MASS mags and colours; ZP is the VISTA zero point defined at the zenith;
atmCor = -extinct * (airmassStart + airmassEnd)/2.0) -1.0) with extinct = 0.05 for all filters;
texpcor = 2.5 * log10(exptime) with exptime being the DIT in seconds;
and apcor is the aperture correction for apermag3 (with 2 arcsec diameter).
We note that these transformations may change in future releases, these give the current v1.1 version. For example, the overall survey calibration (global calibration) can improve using the overlap regions and color information from new data.
Further details
More detailed information can be found at:
- the CASU webpages,
- the VVV Survey webpage,
- the VVV Science Team papers
D. Minniti, P. W. Lucas, J. P. Emerson, R. K. Saito, M. Hempel, P. Pietrukowicz, A. V. Ahumada, M. V. Alonso, J. Alonso-García, J. I. Arias, R. M. Bandyopadhyay, R. H. Barbá, L. R. Bedin, E. Bica, J. Borissova, L. Bronfman, M. Catelan, J. J. Clariá, N. Cross, R. de Grijs, I. Dékány, J. E. Drew, C. Fariña, C. Feinstein, E. Fernández Lajús, R. C. Gamen, D. Geisler, W. Gieren, B. Goldman, O. González, G. Gunthardt, S. Gurovich, N. C. Hambly, M. J. Irwin, V. D. Ivanov, A. Jordán, E. Kerins, K. Kinemuchi, R. Kurtev, M. López-Corredoira, T. Maccarone, N. Masetti, D. Merlo, M. Messineo, I. F. Mirabel, L. Monaco, L. Morelli, N. Padilla, M. C. Parisi, G. Pignata, M. Rejkuba, A. Roman-Lopes, S. E. Sale, M. R. Schreiber, A. C. Schröder, M. Smith, L. Sodré Jr., M. Soto, M. Tamura, C. Tappert, M. A. Thompson, I. Toledo, M. Zoccali, “VISTA Variables in the Via Lactea (VVV): The public ESO near-IR variability survey of the Milky Way”, 2010, New Astronomy, 15, 433 (arXiv:0912.1056)
R. Saito, M. Hempel, J. Alonso-García, I. Toledo, J. Borissova, O. González, J. C. Beamin, D. Minniti, P. Lucas, J. Emerson, A. Ahumada, S. Aigrain, M. V. Alonso, E. de Amôres, R. Angeloni, J. Arias, R. Bandyopadhyay, R. Barbá, B. Barbuy, G. Baume, L. Bedin, E. Bica, L. Bronfman, G. Carraro, M. Catelan, J. J. Clariá, C. Contreras, N. Cross, C. Davis, R. de Grijs, I. Dékány, J. Drew, C. Fariña, C. Feinstein, E. Fernández Lajús, S. Folkes, R. Gamen, D. Geisler, W. Gieren, B. Goldman, A. Gosling, G. Gunthardt, S. Gurovich, N. Hambly, M. Hanson, M. Hoare, M. Irwin, V. Ivanov, A. Jordán, E. Kerins, K. Kinemuchi, R. Kurtev, A. Longmore, M. López-Corredoira, T. Maccarone, E. Martín, N. Masetti, R. Mennickent, D. Merlo, M. Messineo, F. Mirabel, L. Monaco, C. Moni Bidin, L. Morelli, N. Padilla, T. Palma, M. C. Parisi, Q. Parker, D. Pavani, P. Pietrukowicz, G. Pietrzynski, G. Pignata, M. Rejkuba, A. Rojas, A. Roman-Lopes, M. T. Ruiz, S. Sale, I. Saviane, M. Schreiber, A. Schröder, S. Sharma, M. Smith, L. Sodré Jr., M. Soto, A. Stephens, M. Tamura, C. Tappert, M. Thompson, E. Valenti, L. Vanzi, W. Weidmann, M. Zoccali; “VISTA Variables in the Via Lactea: current status and first results”, 2010, The Messenger, 141, 24
- by contacting the VVV Science Team Members.
Data retrieval
Go to the data products query form to find and retrieve the data from the ESO Science Archive. Just press the Search button to find all data belonging to this release, or specify search constraints to find a subset thereof.
Acknowledgements
Users of data products provided in this release are required to acknowledge the source of the data with an appropriate citation in their publications in the form:
Based on data products from observations made with ESO Telescopes at the La Silla or Paranal Observatories under ESO programme ID 179.B-2002.