Paranal Observatory Statistics
On this page, we summarise several statistics to help the astronomical community become familiar with observatory operations and scientific outcomes.
The plots are grouped according to the ESO Paranal Science Operations model:
- Phase 1 - Proposal Submission
- Phase 2 - Scientific Observations
- Publications
The plots are periodically updated and are intended to be self-explanatory. For questions or feedback, please contact us.
Period 117 – First Yearly Cycle for observations at ESO telescopes starting in May 2026.
In September 2025, as announced in the Call for Proposals for P117, ESO moved from the semester-based cycle to a yearly cycle. This change in the duration of the observing period should be taken into consideration for P117 data.
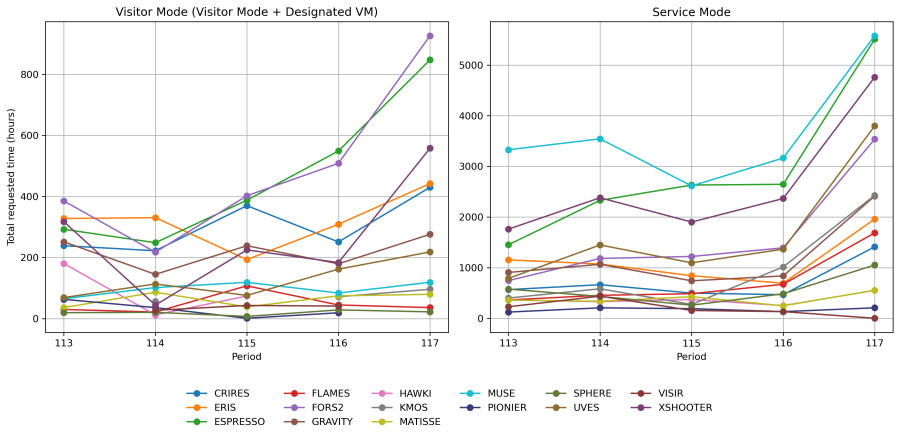
Trend of Requested Time per Instrument in Service Mode and Visitor Mode across Observing Periods
This plot shows how the requested observing time (in hours) for each instrument has changed over the last five observing periods. Each coloured line represents a different instrument, as indicated in the legend below the plot.
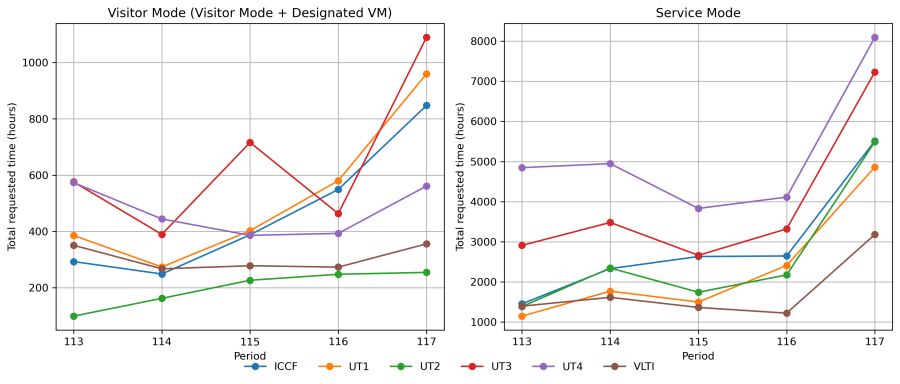
Trend of Requested Time per Telescope in Service Mode and Visitor Mode across Observing Periods
This plot shows how the requested observing time (in hours) for each telescope has changed over the last five observing periods. Each coloured line represents a different telescope, as indicated in the legend below the plot.
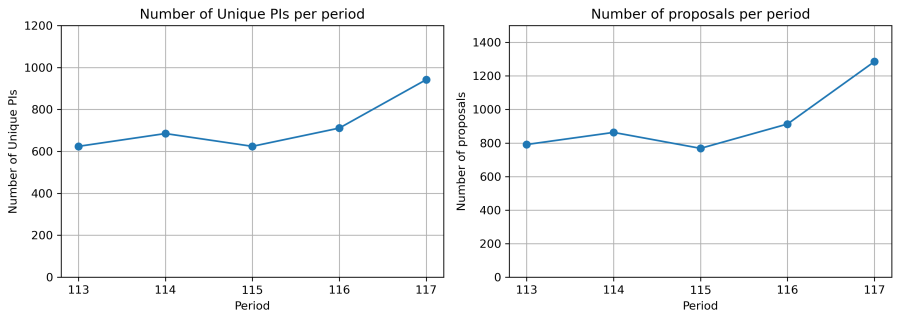
Number of unique PIs and submitted Observing Proposal accross Observing Periods
This plot shows how the number of unique PIs (left panel) and submitted Observing Proposals (right panel) have changed over the last five observing periods.
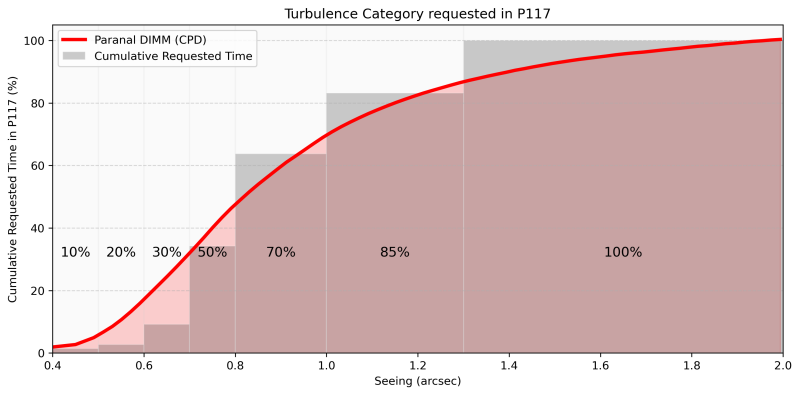
Cumulative Requested Telescope Time vs. Paranal Seeing for a given Observing Period
This plot compares the cumulative distribution of telescope time requested under specific Turbulence Categories (TCs; grey bars) for a given period with the cumulative probability distribution (CPD) of Paranal’s atmospheric seeing (red line). The x-axis shows the seeing in arcseconds, while the shaded vertical bands indicate the ranges of seeing covered within each TC, labelled with their respective TC percentage. The y-axis shows the cumulative fraction of the total requested time within a specific TC (or seeing range).
The plot provides insight into how well the seeing constraints requested in proposals match Paranal’s typical seeing profile. In simple terms, if a particular TC is under- or over-requested, its bar will fall below or rise above the CPD line.
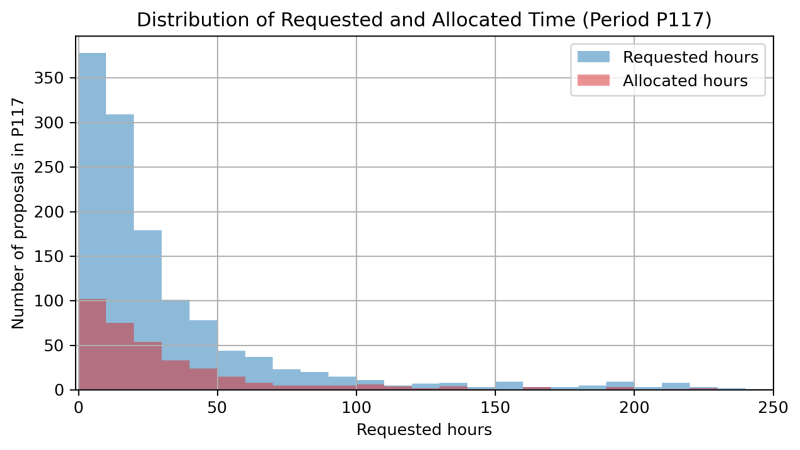
Distribution of Proposals by Requested and Allocated Time for a given Observing Period
This plot shows the number of proposals submitted for Paranal instruments per 10-hour bins of Requsted time. Stacked on top of the Requested proposals is the number of proposals with Allocated times within the range covered by each bin.
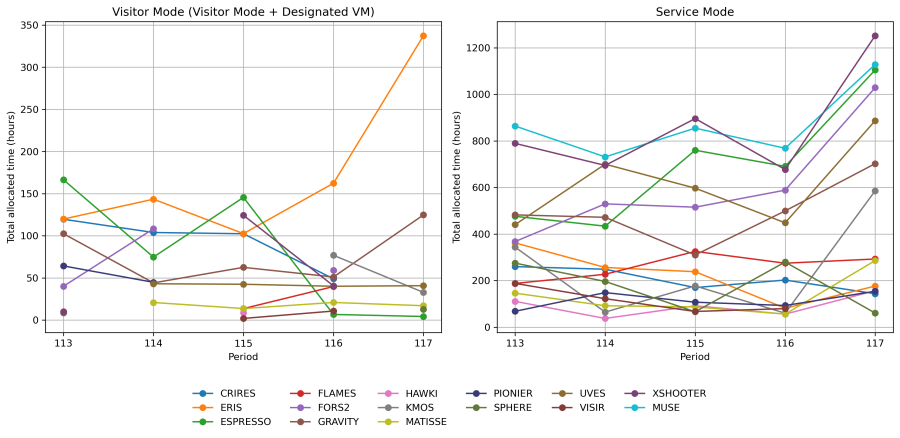
Trend of Allocated Time per Instrument in Service Mode and Visitor Mode across Observing Periods
This plot shows how the allocated observing time (in hours) for each instrument has changed over the last five observing periods. Each coloured line represents a different instrument, as indicated in the legend below the plot.
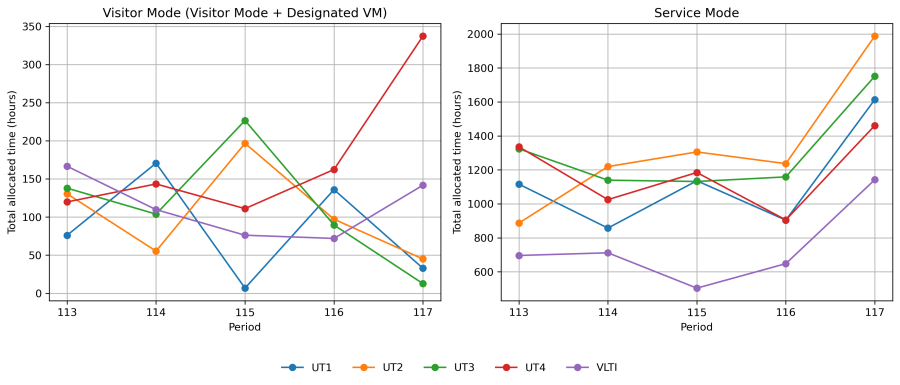
Trend of Allocated Time per Telescope in Service Mode and Visitor Mode across Observing Periods
This plot shows how the allocated observing time (in hours) for each telescope has changed over the last five observing periods. Each coloured line represents a different telescope, as indicated in the legend below the plot.
Special note about ESPRESSO and ICCF: please note that ESPRESSO is hosted at the Incoherent Combined Coudé Focus (ICCF) and can operate in the 1-UT or 4-UTs mode. In short, it can operate with 1 UT or with the light from 4 UTs simultaneously. At the time of scheduling, ESPRESSO 1-UT runs are allocated on a single UT according to scientific priorities and available time. At the time of execution, it is possible to take ESPRESSO observations with any of the UTs. ESPRESSO 4-UTs observations require all UTs and are scheduled in Visitor Mode only. The time allocated to ESPRESSO 4-UTs runs can be seen in the on-line telescope schedule.
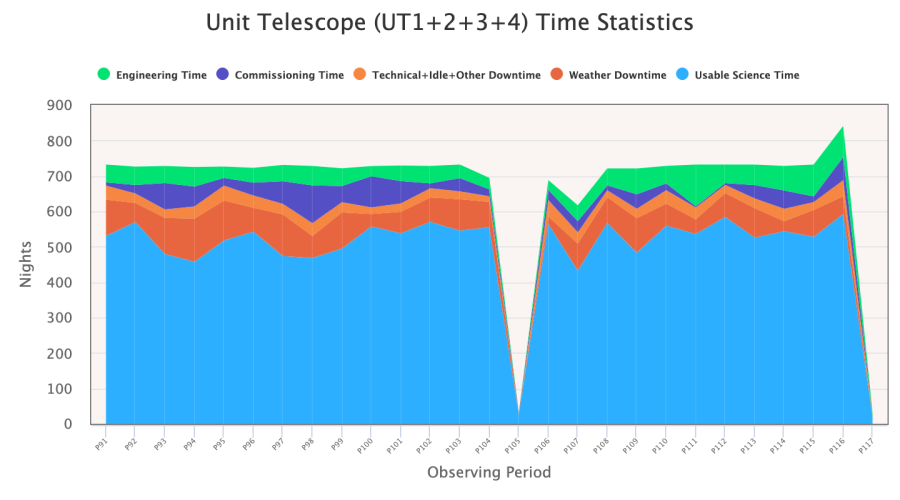
Trend of Telescope Time Usage
Stacked area chart showing the distribution of night-time usage for Unit Telescopes UT1–UT4 across observing periods. The total available nights are divided into categories: Usable Science Time, Weather Downtime, Technical+Idle+Other Downtime, Commissioning Time, and Engineering Time. The sharp drop for Period 105 illustrates the impact of measures implemented in response to the Covid-19 pandemic. The duration of Period 116 is 7 months instead of 6. It spans October 1, 2025 to April 30, 2026. This resulted in slighter larger values for Period 116.
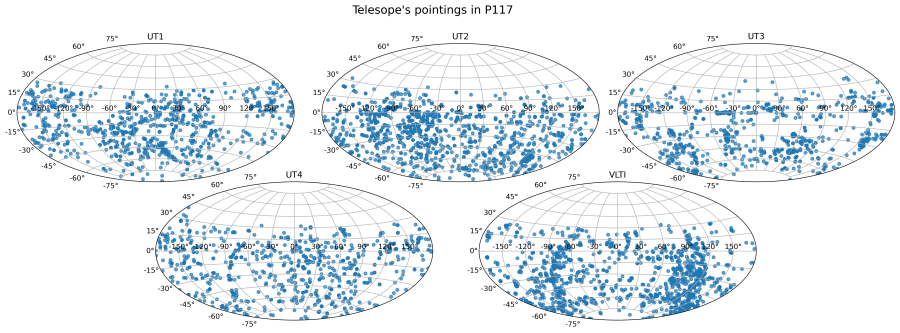
Telescope pointings in a given Observing Period
The plots display Right Ascension (RA) and Declination (Dec) of requested targets for each telescope (UT1, UT2, UT3, UT4, VLTI) in equatorial coordinates, using an Aitoff projection. Each panel corresponds to the pointings for a single telescope, allowing for easy comparison of sky coverage across the facilities at Paranal.
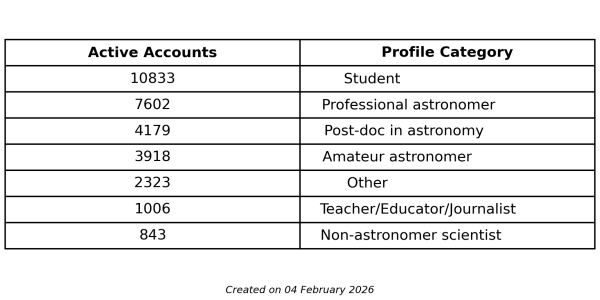
User Portal Accounts
The table lists the number of active ESO User Portal Accounts. The accounts are grouped by career status as declared in the account's profile.
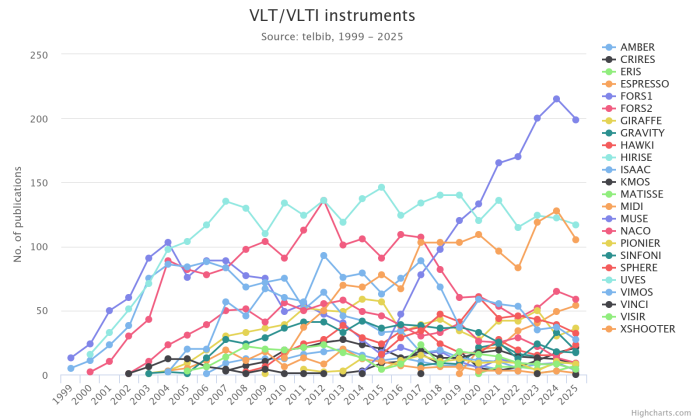
Publication Trends for VLT and VLTI Instruments
The annual number of publications based on data from various VLT and VLTI instruments, as recorded in the ESO Telescope Bibliography (telbib) database, is shown here. The chart illustrates publication trends for different instruments over time and is updated periodically. For more statistics, please visit the ESO Telescope Bibliography Statistics pages.