
This data release provides access to reduced scientific 1D spectra obtained with FORS2, the visual and near-UV FOcal Reducer and low dispersion Spectrograph 2 on the VLT. Data acquired with one of the three spectroscopic modes of FORS2 (within the wavelength range of 330-1100 nm) are included in this release. These modes are long-slit spectroscopy (LSS) using a mask with 6.8′ slit length of different widths, and multi-object spectroscopy with movable slit blades (MOS, slit length about 20′′) or with masks (MXU, arbitrary slit length). The spectroscopic data have been reduced using the FORS2 pipeline version 5.6.1 or higher. Processing includes flat fielding, wavelength calibration, correction of spatial distortion, sky subtraction, optimal extraction of spectra, and flux calibration. The FORS2 pipeline extracts spectra from a single exposure. If several exposures on the same target are executed within the same observing template, the additional reduction step of stacking them together is performed using the ESOTK pipeline (version 0.9.5 or higher). In this case the single exposure spectra are made available as associated files, while the combined spectrum becomes the primary product.
Release of Pipeline Processed FORS2 Spectroscopic 1D Science Products
The FORS2-SPEC data collection contains 1D spectroscopic products starting from January 2022 and its data content will grow with time. As new data are acquired at the observatory, the reduced products will become available in approximately monthly release cycles as soon as they are processed. The 1D spectra inherit the access rights of the raw data accordingly to the standard ESO data access policy: they become public after the proprietary period has expired, typically one year after observation.
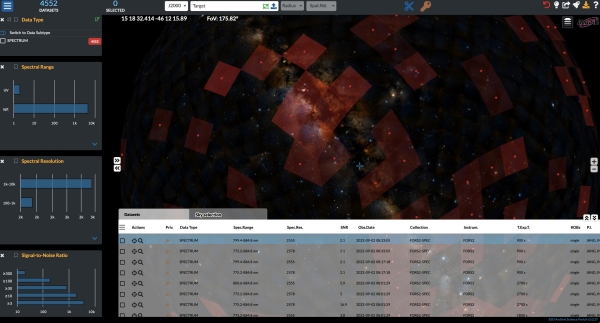
The data products can be queried and downloaded using the ESO Archive Science Portal or the programmatic access.
The 1D spectra are stored in a tabular format following the established standard for ESO science data products. Instructions on how to read or display the spectra can be found in the 1D spectrum data format help page. See the accompanying release description for further information.