
GIRAFFE spectrometer performance
Performance of GIRAFFE
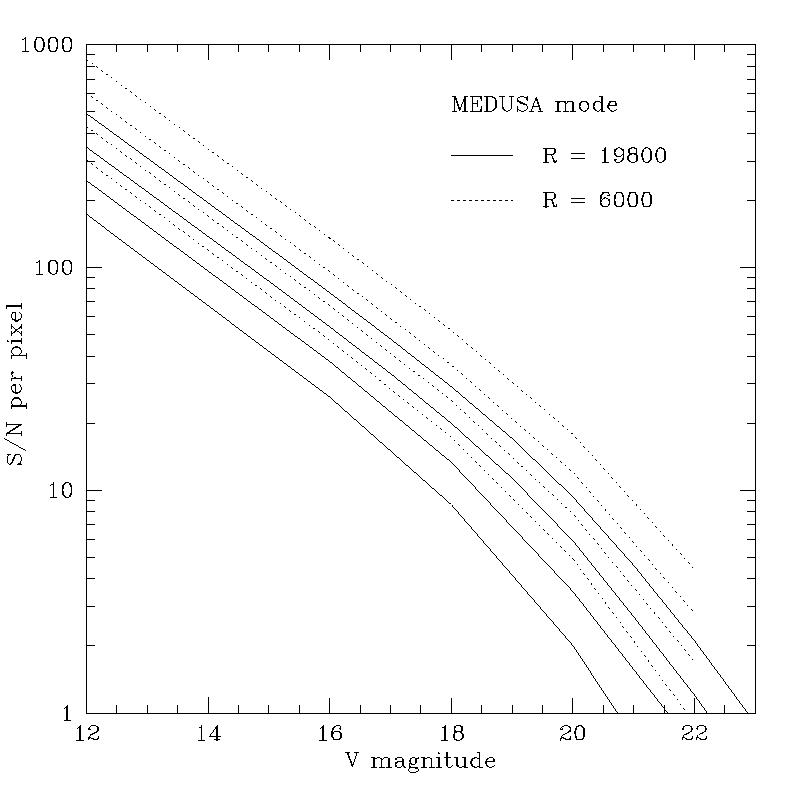
The following figure shows the Signal to Noise ratio (S/N) per pixel(in the spectral direction) as function of V-magnitude for GIRAFFE in MEDUSA single fibers mode, for two different gratings: one with a high spectral resolution (R = 19800,setup HR10) and one with a lower resolution (R = 6000, setup LR4). Depending on the setup, there are 4 to 6 pixels per spectral resolution element. S/N has been calculated for a G2V star, taking into account a seeing of0.8 arcsec and a decentering of 0.0 arcsec. The different lines arefor integration times of 15, 30, 60, and 120 minutes respectively. Click the left figure to get a full scale image.
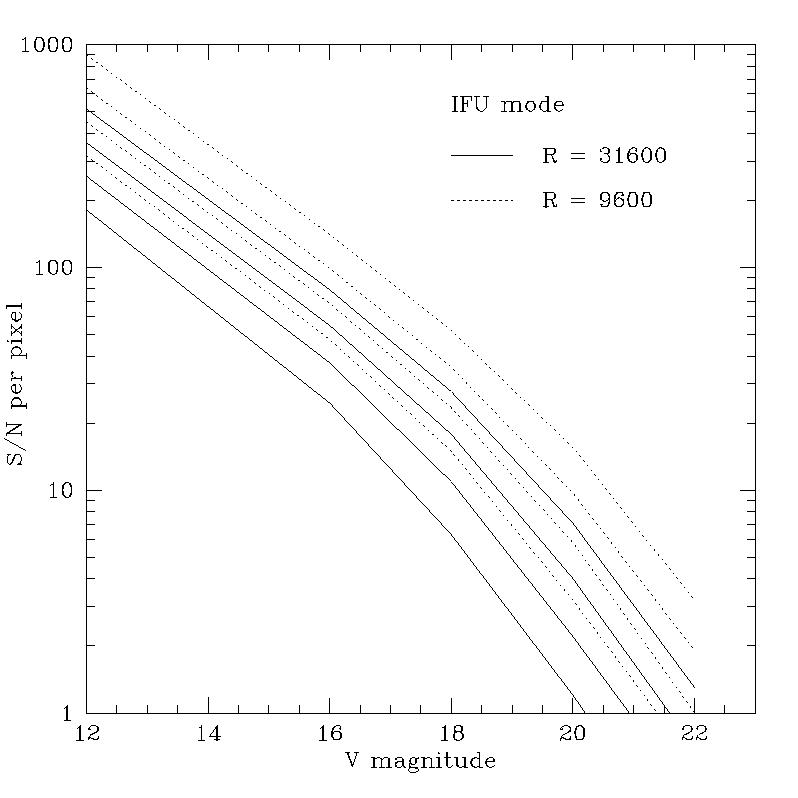
The right figure shows S/N per pixel (in the spectral direction)as function of V-magnitude for GIRAFFE in IFU mode, for two different gratings: one with a high spectral resolution (R = 31600,setup HR10) and one with a lower resolution (R = 9600, setup LR4). The different lines are for integration times of 15, 30, 60, and 120minutes respectively.