
Instrument Performance
ThIS PAGE IS OBSOLETE! For up to date information see the ESO ETC!
It is kept only to maintain historic pre-2009 reccord of the instrument evolution and for reference.
Overheads
When estimating the total time required for a programme it is recommended to include about 3 min on average for each target acquisition and around 20-30% of the estimated integration time for instrument overheads. Larger overheads of up to 100% may be justified for programmes requiring many short integrations (imaging with DIT less than 2-3 sec) and/or complex target acquisition (e.g faint sources for spectroscopy in which case time should be allowed for first imaging the field and then offsetting the target into the slit).
The users are reccommended to creat sample obs with P2PP and to get the execution times from there.
Broad Band Limits
| 1 minute | 1 minute | 1 hour | 1 hour | |
| Filter | Continuum 10-16erg.s-1.cm-2.A-1 |
Magnitude | Continuum 10-16erg.s-1.cm-2.A-1 |
Magnitude |
| J (1.25) | 1.4 x 10⁻² | 20.7 | 2 x 10⁻³ | 22.9 |
| H (1.65) | 1.9 x 10⁻² | 19.7 | 2.4 x 10⁻³ | 21.9 |
| Ks (2.16) | 1.2 x 10⁻² | 18.7 | 1.6 x 10⁻³ | 20.9 |
Narrow Band Limits
| 1 minute | 1 minute | 1 hour | 1 hour | |
| Filter | Continuum 10-16erg.s-1.cm-2.A-1 |
Emission Line 10-16erg.s-1.cm-2 |
Continuum 10-16erg.s-1.cm-2.A-1 |
Emission Line 10-16erg.cm-2.s-1 |
| 1.083 | 6.3 x 10⁻² | 9.3 | 8.1 x 10⁻³ | 1.2 |
| 1.187 | 3.0 x 10⁻² | 3.8 | 3.8 x 10⁻³ | 0.48 |
| 1.215 | 7.5 x 10⁻² | 14.5 | 9.5 x 10⁻³ | 1.9 |
| 1.257 | 3.6 x 10⁻² | 7.3 | 4.6 x 10⁻³ | 0.93 |
| 1.282 | 7.4 x 10⁻² | 15 | 9.5 x 10⁻³ | 1.9 |
| 1.644 | 6.3x 10⁻² | 16.5 | 8.1 x 10⁻³ | 2.1 |
| 1.710 |
6.3 x 10⁻² | 17.3 | 8.1 x 10⁻³ | 2.2 |
| 2.058 | 3.0 x 10⁻² | 9.3 | 3.9 x 10⁻³ | 1.2 |
| 2.090 | 3.1 x 10⁻² | 7.0 | 4.0 x 10⁻³ | 0.9 |
| 2.122 | 2.9 x 10⁻² | 9.3 | 3.8 x 10⁻³ | 1.2 |
| 2.166 | 3.2 x 10⁻² | 9.7 | 4.1 x 10⁻³ | 1.3 |
| 2.195 | 3.6 x 10⁻² | 11.4 | 4.6 x 10⁻³ | 1.5 |
| 2.280 | 3.1 x 10⁻² | 10 | 4.0 x 10⁻³ | 1.3 |
| 2.248 | 3.2 x 10⁻² | 9.3 | 4.2 x 10⁻³ | 1.2 |
| 2.336 | 3.8 x 10⁻² | 12.4 | 4.9 x 10⁻³ | 1.6 |
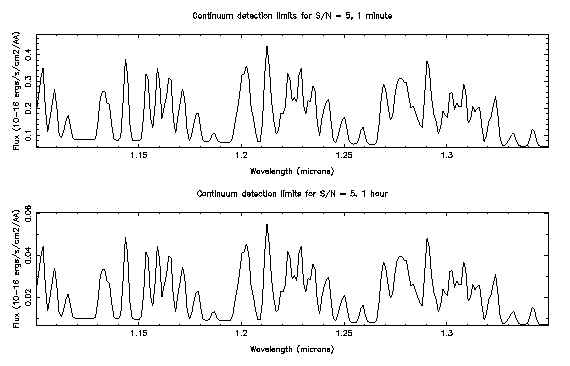
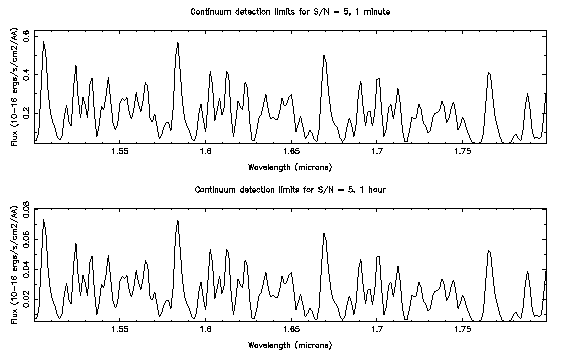
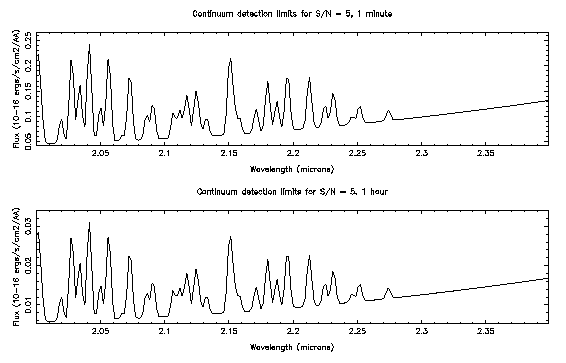
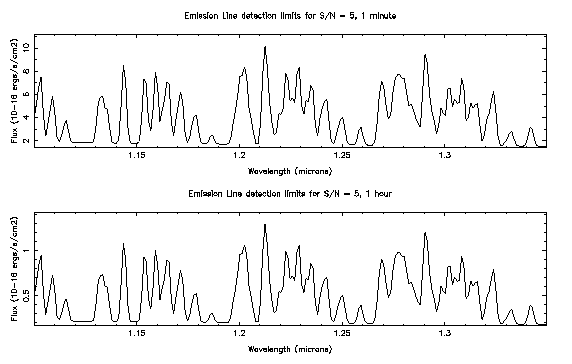
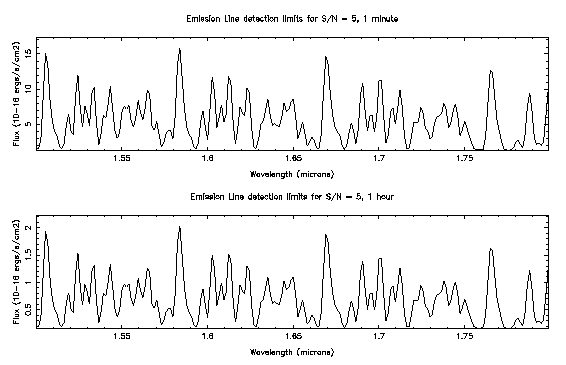
Spectroscopic Limits
The sensitivity is a strong function of wavelength. For continuum sources, the sensitivity is plotted separately for the J, H and K atmospheric windows.
For emission line sources, the sensitivity is plotted separately for the J, H and K atmospheric windows.