HARPS Line FWHM Monitoring
FWHM monitoring in ThAr exposures
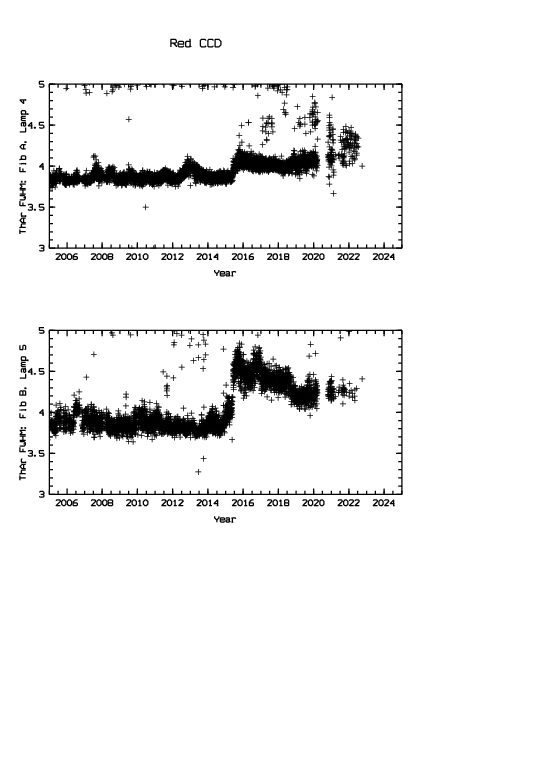
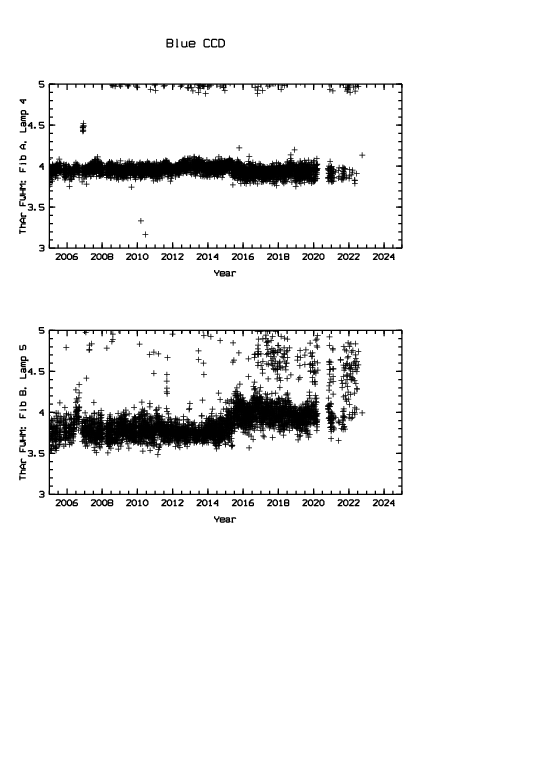
Following is the plot of the time evolution of the FWHM of emission lines from the ThAr lamps. "Fiber A" is illuminated by "lamp4" (or "ThAr1"), "Fiber B" is illuminated by "lamp5" (or "ThAr2"). The data are obtained from the "spot" files, generated by the pipeline for every ThAr calibration exposure. Only the last exposure of the day, taken just before the beginning of the night, is considered.
A trend different from flat might be due to a lamp change, strong stress in the fibre (change of the FRD) or movement of parts inside the spectrograph (earthquakes).


