NaCo: SDI+4
SDI+4 is a new mode of NaCo offered as of P81 (April 2008). It was commissioned, together with the new 4QPMs by a team from LESIA, Observatoire de Paris, led by A. Boccaletti and collaborators (J. Baudrand, P.Riaud and P. Baudoz).
The SDI+ mode of CONICA can be combined with the 4 quadrants phase mask optimized for the H band to achieve high contrast and improve the detectability of faint substellar companions near bright stars, ideallydown to massive EGPs, by reducing the photon noise at small angular separations. The advantages of this newmode are:
- it allows deeper integration (by about a factor 50 to 100) with respect to conventional imaging with SDI(unsaturated).
- It allows to get closer to the central star.
This mode is now completely commissioned, and is offered in VM only as of P81. Please refer to manual for more information on the mode and its characterization.
Night tests with SDI+4
Report from the commissioning team
AB Dor was also observed with SDI+ and the 4QPM_H.Instead of a reference star, a second observation of the same duration was achieved with a field rotation of 72°. We combined 9 images of DIT=8s, NDIT=13.At this stage of the report we are missing Flat Field for SDI, which prevents accurate photometry of the companion and subtraction of sub-images.
We measured the relative position of sub-images with Gaussian fitting for PSF images and for coronagraphic images (centering on the brightest speckle).Instead of over-sampling the images to improve accuracy of the spectral rescaling, we used zero padding to avoid too much re-sampling issues.We searched for the array size DIM at which λ(0)/λ(1)xDIM is an even integer, then we applied re-sampling to rescale the sub-images. Some tweaking of the image position at the sub-pixel scale was necessary. We computed Single Subtraction (SS) in between thefour pairs of filters λ(0) - λ(2), λ(0)- λ(3),λ(1)- λ(2), λ(1)- λ(3)) and also Double Subtraction(DS) considering field rotated images as a second level of calibration.
The advantage of a coronagraph is obvious on the 2 first images in Fig. 1
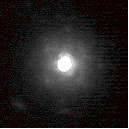

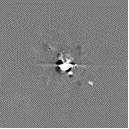
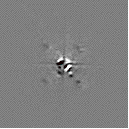
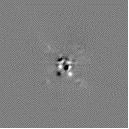
Fig. 1: PSF and coronagraphic images at 1.6 microns (top-left, top-middle) plus theSDI-like processing for the single subtraction (top-right) the double subtraction(bottom-left) and the single subtraction with the 2 angular position on whichAB Dor C clearly appears (bottom-right).
Finally, we also computed single subtraction at 1.6 microns for the 2 angular positions,which is in the case of AB Dor the only way to evidence the companion since it doesnot contain methane. Although this latter method maximizes the companion detectability it does not provide a very large contrast. Indeed, the speckle pattern between the 2field rotated data is very much different. Achievable contrasts are displayed in Figure 2.

Fig. 2: Radial profiles of PSF and coronagraphic image (solid and dotted).Coloured lines stand for the 5 sigma detection level when SDI processing is applied forthe PSFs (blue) and for 4QPM images (red). The green line corresponds to the doublesubtraction which combine SDI and ADI (Angular Differential Imaging)
SDI processing on 4QPM images is marginally better than for PSF images in the range 0.1-0.5 arcsec(a factor 2 on average) while at larger radii the benefit of a coronagraph is quite clear.Second of all, the calibration with a second observation of the same object but with the field rotated is not very much efficient. Actually, the contrast performance are here identical to that obtained with the Ks coronagraph with a classical observation involving the use of a reference star.
Tests with SDI+4 and rotations
The star HD4113 and its reference was observed with SDI+ and the 4QPM_H on the 24/09/07.
A set of 11 images of 2 minutes (DIT=30s, NDIT=4) has been recorded for the star(10 for the reference star). Between each images, the instrument angle has been increased by 5 degrees.
After a first processing of the data (removal of sky and bad pixel and applying of flat-field correction),we rescaled the data according to their wavelength using the same technique that the one described for the4QPM
The four images are centred at the sub-pixel level. We computed single SDI subtraction in between the four pairsof filters (λ(0) - λ(2), λ(0) - λ(3), λ(1) - λ(2), λ(1) - λ(3)).
We also studied several processing techniques more advanced that a SDI image between two filters. We computed the detection level of companion by azimuthally calculating the root mean square on the processes images. The results are shown in Fig. 3. In this figure, we compare the detection level that can reach the classical (no SDI) coronagraphic imaging (using reference subtraction or not), with coronagraphic+SDI imaging(using subtraction of SDI images of the reference or not). The effect of rollaveraging is also studied. The reference subtraction is only done on 3/4th of the data (8 images out of 11) to match the parallactic angle of the star and its reference. All techniques that are not involving roll averaging are added without rotation whilethe data have been recorded with a rotation of the instrument.
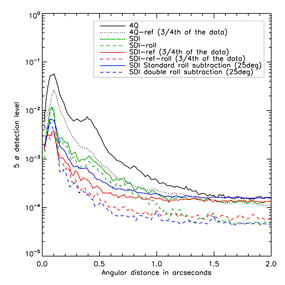
Fig. 3: 5 sigma detection level for different processing techniques.4Q and 4Q-ref stand for direct coronagraphic imaging respectively not usingand using reference subtraction. For all the lines that are called SDI, weare studying the spectral subtraction (image at 1.575 microns- image at 1.625 microns).SDI and SDI-roll show the results of SDI subtraction with and without roll averaging.It is the same for SDI-ref and SDI-ref-roll but using also the subtraction of the SDIimage of a reference star at the same parallactic angle. The SDI double subtractionis described in details in the text. For the detection level estimation, we supposedthat the companion has a contrast of 100% in the methane band (no flux in the image at 1.625 microns)
In Figure 3, the SDI processing (solid green) appears to be slightly better for theshort angular separation (less than 0.4 arcsec) than the coronagraphic imaging using subtractionof a reference star (dotted black). To see the effect of the rotation, we added the different images we recorded after correcting for the instrument rotation in order to add up companionsignal while averaging out speckle and readout noise. The effect is clearly an improvement ofthe detection capability especially at large angular distances (dashed green).
We also investigated the subtraction of the SDI image of the star with the SDI image of the reference star (solid red). This technique is more efficient than the SDI image at angular distance shorter than 1 arcsec and is the same further away. Roll averaging improves also the detection capability of the instrument (dashed red). The standard SDI processing which consist in 2 observations at of 2 roll angles separated by 33° is also given in blue,but for 25° apart. This result in a small improvement with respect to SDI (green line).
Another technique, which is called double roll subtraction, has been tested (dashed blue).It consists in using only SDI data of the star and subtracting the SDI star data to themselves but with different angular separations. For example, we calculate the images that have a separation of25° :SDI(0°) - SDI(25°) and SDI(5°) - SDI(30°)and SDI(10°) - SDI(35°), etc up to SDI(25°) - SDI(50°).
Adding them after having rotated them of the right amount will add up the information of the companion. However, we have only added 6 times the information of the companion while we have a total of 11 images (and subtracted out 6 images). To add up the other 5 images, we can for example subtract to the 5 images that have not been added yet (SDI(30°) to SDI(50°), note that they were used for subtraction though)the images that show an angle difference of -25° : SDI(50°) - SDI(25°) , SDI(45°) - SDI(20°), etcto SDI(30°) - SDI(5°). Adding all these roll subtracted images corrected from the instrument anglewill create a typical spatial structure made of a positive PSF at the companion position and 2 negative PSF located at 25° on each side of the companion (see Figure 4). The profile in Figure 4 clearly shows an improvement of about 1 mag with respect to standard SDI data reduction (SDI + 2 rolls).
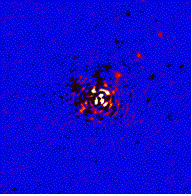
Fig. 4: final image using double roll subtraction. 3 fake companions were inserted at 45°in the images before the angle processing. The negative PSFs are also visible in the image.The 3 companions are created by multiplying by 10-4 the PSF star without coronagraph.The angular distances of the companions correspond to 0.5, 1 and 1.5 arcsec respectively.
Obviously, for a companion located at close angular separation, the PSFs may overlap and subtract themselves. In our case, a simple simulation using the real PSF image has been used to estimate the attenuation of the positive PSF. For an angle of 25°,the PSF is attenuated by 20% at 150mas and less than 4% at 300 mas. The blue curve showedin Figure 1 has been corrected from this effect by dividing the detection level calculated on the double roll subtraction images by the theoretical attenuation.
This last techniqueis outperforming all the others except at very short angular separation (less than 0.15 arcsec) where the SDI subtracted by a SDI reference is better. However, since it does not use a reference image,the recorded time on the studied star is doubled for a given observing time. For this reason,we advise to record images with rotation steps of the instrument and use this double roll subtraction technique to improve at its best the efficiency of the instrument.
In terms of operations, the rotation of the instrument is already implemented inthe templates and is not time consuming. However during the rotation, the positionof the star is changed compared to the coronagraph mask and a re-centring is mandatory, albeit time consuming.
Extended Objects
The bad seeing conditions we experienced during commissioning and GTO in Feb.and Sept. 2007 prevent us to obtain reliable data on extended object. However, the capability of the 4QPM installed in NACO on extended objecthas been already demonstrated and published for the case of AGN inGratadour et al. 2004 and young stellar disks in Riaud et al. 2006.
