mirror sites: PL (internal link) HQ     [?]

Health Check monitor


CAL | HC | QC
HealthCheck Monitor
   HOME | UsersGuide
  sl icon ALL INSTRUMENTS
 
all KPI reports
ERIS:
wavelength coeff
Other HC:
QC links:
        [page auto-refreshes after 300 sec]   [stop | on]            [press Ctrl+Shift+R to enforce refresh of scores, dates and news]
ERIS trending system: HEALTH CHECK report
HELP USERS-GUIDE MORE
Last update: 2026-04-17T08:17:39 (UT)
  | now: 2026-04-17T11:17:46 (UT) muc04 QC pipeline: eris-1.8.14 (installed 2025-11-14)
same group: C0_J_band H K C1_J_band H K C2_J_band H K C3_J_band H K
General news: NOTE: The Health Check and calChecker services have been moved to qcFlow. These pages are only maintained for comparison and will be removed in 2026.
ERIS news:  
Report news:
DATE*: [?] 2026-04-10
report | NLT
2026-04-11
report | NLT
2026-04-12
report | NLT
2026-04-13
report | NLT
2026-04-14
report | NLT
2026-04-15
report | NLT
2026-04-16
report | NLT
r...
Raw CAL displays:
raw raw raw raw raw no CAL raw files raw
P...
CAL product quality:
products products products products products no CAL products products
 
transfer   ngas [?]

scores&comments | FULL | history ... | plot tutorial ... | contact | HC_docu... | quality events...                 daily/often; important to check     [?]
*Date on this monitor changes at 21:00 UT
png: Information and research:
- png file - advanced studies: QC1 browser | QC1 plotter
Plot
?
Symb
?
Source
*
Average ? Thresholds ? N_
data
QC1
parameter
Data
downloads
Remarks
method value unit method value
1 QC1DB MEDIAN -2.14e-13 microns/pix^3 VAL-2.99000E-13,-1.13000E-13 8 qc_wave_c3_med this | last_yr | all 
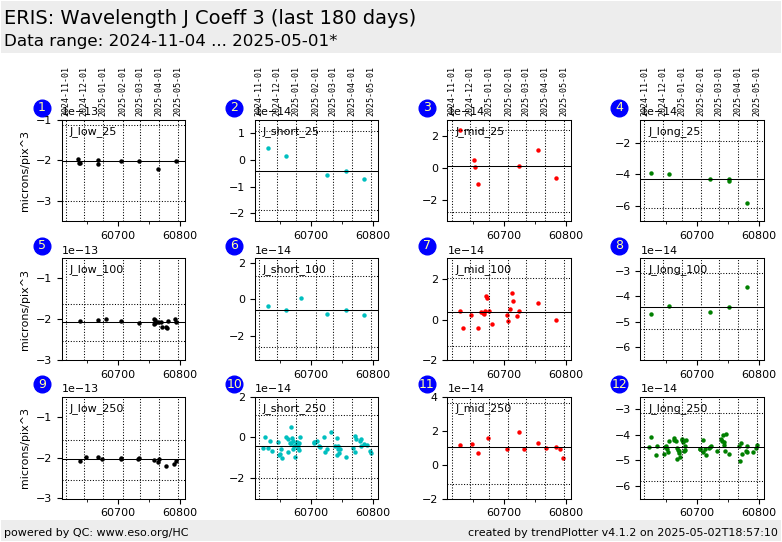
C3 coeff wavelength (microns/pix^3):: J_low/25 mas scale
2 QC1DB MEDIAN -5.1e-15 microns/pix^3 VAL-1.86000E-14,1.08000E-14 5 qc_wave_c3_med this | last_yr | all C3 coeff wavelength (microns/pix^3):: J_short/25 mas scale
3 QC1DB MEDIAN -5.7e-15 microns/pix^3 VAL-2.69000E-14,2.36000E-14 6 qc_wave_c3_med this | last_yr | all C3 coeff wavelength (microns/pix^3):: J_middle/25 mas scale
4 QC1DB MEDIAN -4.66e-14 microns/pix^3 VAL-6.15000E-14,-1.86000E-14 4 qc_wave_c3_med this | last_yr | all C3 coeff wavelength (microns/pix^3):: J_long/25 mas scale

5 QC1DB MEDIAN -2.11e-13 microns/pix^3 VAL-2.52400E-13,-1.63900E-13 10 qc_wave_c3_med this | last_yr | all C3 coeff wavelength (microns/pix^3):: J_low/100 mas scale
6 QC1DB MEDIAN -5.7e-15 microns/pix^3 VAL-2.58000E-14,1.25000E-14 5 qc_wave_c3_med this | last_yr | all C3 coeff wavelength (microns/pix^3):: J_short/100 mas scale
7 QC1DB MEDIAN 1e-15 microns/pix^3 VAL-1.31000E-14,2.06000E-14 4 qc_wave_c3_med this | last_yr | all C3 coeff wavelength (microns/pix^3):: J_middle/100 mas scale
8 QC1DB MEDIAN -4.31e-14 microns/pix^3 VAL-5.28000E-14,-3.07000E-14 10 qc_wave_c3_med this | last_yr | all C3 coeff wavelength (microns/pix^3):: J_long/100 mas scale

9 QC1DB MEDIAN -2.07e-13 microns/pix^3 VAL-2.55500E-13,-1.57000E-13 16 qc_wave_c3_med this | last_yr | all C3 coeff wavelength (microns/pix^3):: J_low/250 mas scale
10 QC1DB MEDIAN -4e-15 microns/pix^3 VAL-2.01000E-14,1.11000E-14 22 qc_wave_c3_med this | last_yr | all C3 coeff wavelength (microns/pix^3):: J_short/250 mas scale
11 QC1DB MEDIAN 1e-14 microns/pix^3 VAL-1.14000E-14,3.60000E-14 11 qc_wave_c3_med this | last_yr | all C3 coeff wavelength (microns/pix^3):: J_middle/250 mas scale
12 QC1DB MEDIAN -4.52e-14 microns/pix^3 VAL-5.80000E-14,-3.13000E-14 10 qc_wave_c3_med this | last_yr | all C3 coeff wavelength (microns/pix^3):: J_long/250 mas scale

*Data sources: QC1DB: QC1 database; LOCAL: local data source
Plot 1
scores: not implemented
data source:eris_ifu_wave
(QC1 database)
dataset:qc_wave_c3_med
median:-2.14e-13microns/pix^3
fixed thresholds:-2.99e-13...-1.13e-13microns/pix^3
N_data plotted:8
[click plot for closeup]
Plot 2
scores: not implemented
data source:eris_ifu_wave
(QC1 database)
dataset:qc_wave_c3_med
median:-5.1e-15microns/pix^3
fixed thresholds:-1.86e-14...1.08e-14microns/pix^3
N_data plotted:5
[click plot for closeup]
Plot 3
scores: not implemented
data source:eris_ifu_wave
(QC1 database)
dataset:qc_wave_c3_med
median:-5.7e-15microns/pix^3
fixed thresholds:-2.69e-14...2.36e-14microns/pix^3
N_data plotted:6
[click plot for closeup]
Plot 4
scores: not implemented
data source:eris_ifu_wave
(QC1 database)
dataset:qc_wave_c3_med
median:-4.66e-14microns/pix^3
fixed thresholds:-6.15e-14...-1.86e-14microns/pix^3
N_data plotted:4
[click plot for closeup]
Plot 5
scores: not implemented
data source:eris_ifu_wave
(QC1 database)
dataset:qc_wave_c3_med
median:-2.11e-13microns/pix^3
fixed thresholds:-2.524e-13...-1.639e-13microns/pix^3
N_data plotted:10
[click plot for closeup]
Plot 6
scores: not implemented
data source:eris_ifu_wave
(QC1 database)
dataset:qc_wave_c3_med
median:-5.7e-15microns/pix^3
fixed thresholds:-2.58e-14...1.25e-14microns/pix^3
N_data plotted:5
[click plot for closeup]
Plot 7
scores: not implemented
data source:eris_ifu_wave
(QC1 database)
dataset:qc_wave_c3_med
median:1e-15microns/pix^3
fixed thresholds:-1.31e-14...2.06e-14microns/pix^3
N_data plotted:4
[click plot for closeup]
Plot 8
scores: not implemented
data source:eris_ifu_wave
(QC1 database)
dataset:qc_wave_c3_med
median:-4.31e-14microns/pix^3
fixed thresholds:-5.28e-14...-3.07e-14microns/pix^3
N_data plotted:10
[click plot for closeup]
Plot 9
scores: not implemented
data source:eris_ifu_wave
(QC1 database)
dataset:qc_wave_c3_med
median:-2.07e-13microns/pix^3
fixed thresholds:-2.555e-13...-1.57e-13microns/pix^3
N_data plotted:16
[click plot for closeup]
Plot 10
scores: not implemented
data source:eris_ifu_wave
(QC1 database)
dataset:qc_wave_c3_med
median:-4e-15microns/pix^3
fixed thresholds:-2.01e-14...1.11e-14microns/pix^3
N_data plotted:22
[click plot for closeup]
Plot 11
scores: not implemented
data source:eris_ifu_wave
(QC1 database)
dataset:qc_wave_c3_med
median:1e-14microns/pix^3
fixed thresholds:-1.14e-14...3.6e-14microns/pix^3
N_data plotted:11
[click plot for closeup]
Plot 12
scores: not implemented
data source:eris_ifu_wave
(QC1 database)
dataset:qc_wave_c3_med
median:-4.52e-14microns/pix^3
fixed thresholds:-5.8e-14...-3.13e-14microns/pix^3
N_data plotted:10
[click plot for closeup]
General information

Click on any of the plots to see a close-up version.

The latest date is indicated on top of the plot.

If configured,

  • data points belonging to the latest date are specially marked
  • statistical averages are indicated by a solid line, and thresholds by broken lines
  • outliers are marked by a red asterisk. They are defined as data points outside the threshold lines
  • "aliens" (= data points outside the plot Y limits) are marked by a red arrow ( or )
  • you can download the data for each parameter set if the 'Data downloads' link shows up