Plot
? |
Symb
? |
Source
* |
Average ? |
Thresholds ? |
N_
data |
QC1
parameter |
Data
downloads |
Remarks |
| method |
value |
unit |
method |
value |
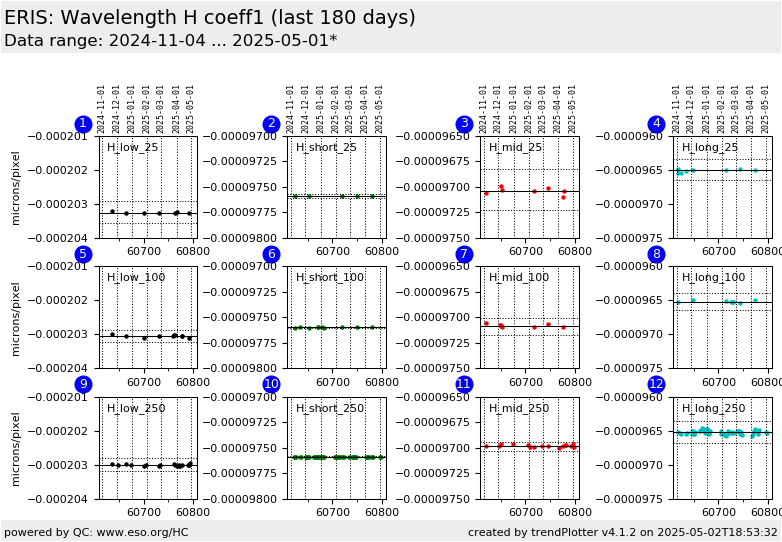
| 1 |
• | QC1DB |
MEDIAN |
-0.000203 |
microns/pixel |
VAL | -0.000203562,-0.000202928 |
10 |
qc_wave_c1_med |
this |
last_yr |
all
|
C1 coeff wavelength (microns/pixel):: H_low/25 mas scale |
| 2 |
• | QC1DB |
MEDIAN |
-9.76e-05 |
microns/pixel |
VAL | -0.0000976085,-0.0000975727 |
5 |
qc_wave_c1_med |
this |
last_yr |
all
|
C1 coeff wavelength (microns/pixel):: H_short/25 mas scale |
| 3 |
• | QC1DB |
MEDIAN |
-9.7e-05 |
microns/pixel |
VAL | -0.000097229,-0.000096825 |
7 |
qc_wave_c1_med |
this |
last_yr |
all
|
C1 coeff wavelength (microns/pixel):: H_middle/25 mas scale |
| 4 |
• | QC1DB |
MEDIAN |
-9.65e-05 |
microns/pixel |
VAL | -0.000096651,-0.000096336 |
8 |
qc_wave_c1_med |
this |
last_yr |
all
|
C1 coeff wavelength (microns/pixel):: H_long/25 mas scale |
|
| 5 |
• | QC1DB |
MEDIAN |
-0.000203 |
microns/pixel |
VAL | -0.000203229,-0.000202874 |
11 |
qc_wave_c1_med |
this |
last_yr |
all
|
C1 coeff wavelength (microns/pixel):: H_low/100 mas scale |
| 6 |
• | QC1DB |
MEDIAN |
-9.76e-05 |
microns/pixel |
VAL | -0.0000976074,-0.0000975938 |
5 |
qc_wave_c1_med |
this |
last_yr |
all
|
C1 coeff wavelength (microns/pixel):: H_short/100 mas scale |
| 7 |
• | QC1DB |
MEDIAN |
-9.71e-05 |
microns/pixel |
VAL | -0.000097172,-0.00009701 |
6 |
qc_wave_c1_med |
this |
last_yr |
all
|
C1 coeff wavelength (microns/pixel):: H_middle/100 mas scale |
| 8 |
• | QC1DB |
MEDIAN |
-9.65e-05 |
microns/pixel |
VAL | -0.000096642,-0.000096389 |
7 |
qc_wave_c1_med |
this |
last_yr |
all
|
C1 coeff wavelength (microns/pixel):: H_long/100 mas scale |
|
| 9 |
• | QC1DB |
MEDIAN |
-0.000203 |
microns/pixel |
VAL | -0.000203199,-0.000202815 |
11 |
qc_wave_c1_med |
this |
last_yr |
all
|
C1 coeff wavelength (microns/pixel):: H_low/250 mas scale |
| 10 |
• | QC1DB |
MEDIAN |
-9.76e-05 |
microns/pixel |
VAL | -0.0000975968,-0.0000975848 |
22 |
qc_wave_c1_med |
this |
last_yr |
all
|
C1 coeff wavelength (microns/pixel):: H_short/250 mas scale |
| 11 |
• | QC1DB |
MEDIAN |
-9.7e-05 |
microns/pixel |
VAL | -0.0000970354,-0.0000969426 |
11 |
qc_wave_c1_med |
this |
last_yr |
all
|
C1 coeff wavelength (microns/pixel):: H_middle/250 mas scale |
| 12 |
• | QC1DB |
MEDIAN |
-9.65e-05 |
microns/pixel |
VAL | -0.000096679,-0.000096358 |
23 |
qc_wave_c1_med |
this |
last_yr |
all
|
C1 coeff wavelength (microns/pixel):: H_long/250 mas scale |
|
| |
|
*Data sources: QC1DB: QC1 database; LOCAL: local data source
|
