Plot
? |
Symb
? |
Source
* |
Average ? |
Thresholds ? |
N_
data |
QC1
parameter |
Data
downloads |
Remarks |
| method |
value |
unit |
method |
value |
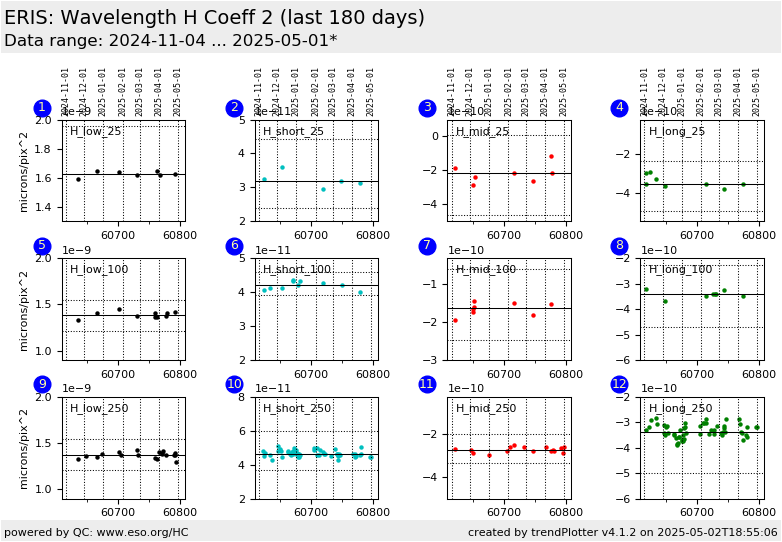
| 1 |
• | QC1DB |
MEDIAN |
1.61e-09 |
microns/pix^2 |
VAL | 0.000000001274,0.000000001954 |
10 |
qc_wave_c2_med |
this |
last_yr |
all
|
C2 coeff wavelength (microns/pix^2):: H_low/25 mas scale |
| 2 |
• | QC1DB |
MEDIAN |
3.08e-11 |
microns/pix^2 |
VAL | 0.0000000000238,0.0000000000442 |
5 |
qc_wave_c2_med |
this |
last_yr |
all
|
C2 coeff wavelength (microns/pix^2):: H_short/25 mas scale |
| 3 |
• | QC1DB |
MEDIAN |
-2.2e-10 |
microns/pix^2 |
VAL | -0.00000000046,0.00000000001 |
7 |
qc_wave_c2_med |
this |
last_yr |
all
|
C2 coeff wavelength (microns/pix^2):: H_middle/25 mas scale |
| 4 |
• | QC1DB |
MEDIAN |
-3.26e-10 |
microns/pix^2 |
VAL | -0.000000000494,-0.000000000238 |
8 |
qc_wave_c2_med |
this |
last_yr |
all
|
C2 coeff wavelength (microns/pix^2):: H_long/25 mas scale |
|
| 5 |
• | QC1DB |
MEDIAN |
1.39e-09 |
microns/pix^2 |
VAL | 0.000000001217,0.000000001545 |
11 |
qc_wave_c2_med |
this |
last_yr |
all
|
C2 coeff wavelength (microns/pix^2):: H_low/100 mas scale |
| 6 |
• | QC1DB |
MEDIAN |
4.08e-11 |
microns/pix^2 |
VAL | 0.00000000003904,0.00000000004597 |
5 |
qc_wave_c2_med |
this |
last_yr |
all
|
C2 coeff wavelength (microns/pix^2):: H_short/100 mas scale |
| 7 |
• | QC1DB |
MEDIAN |
-1.49e-10 |
microns/pix^2 |
VAL | -0.000000000247,-0.000000000059 |
7 |
qc_wave_c2_med |
this |
last_yr |
all
|
C2 coeff wavelength (microns/pix^2):: H_middle/100 mas scale |
| 8 |
• | QC1DB |
MEDIAN |
-3.23e-10 |
microns/pix^2 |
VAL | -0.000000000471,-0.000000000229 |
7 |
qc_wave_c2_med |
this |
last_yr |
all
|
C2 coeff wavelength (microns/pix^2):: H_long/100 mas scale |
|
| 9 |
• | QC1DB |
MEDIAN |
1.37e-09 |
microns/pix^2 |
VAL | 0.000000001205,0.000000001538 |
12 |
qc_wave_c2_med |
this |
last_yr |
all
|
C2 coeff wavelength (microns/pix^2):: H_low/250 mas scale |
| 10 |
• | QC1DB |
MEDIAN |
4.57e-11 |
microns/pix^2 |
VAL | 0.000000000037,0.0000000000599 |
19 |
qc_wave_c2_med |
this |
last_yr |
all
|
C2 coeff wavelength (microns/pix^2):: H_short/250 mas scale |
| 11 |
• | QC1DB |
MEDIAN |
-2.69e-10 |
microns/pix^2 |
VAL | -0.000000000335,-0.000000000203 |
11 |
qc_wave_c2_med |
this |
last_yr |
all
|
C2 coeff wavelength (microns/pix^2):: H_middle/250 mas scale |
| 12 |
• | QC1DB |
MEDIAN |
-3.31e-10 |
microns/pix^2 |
VAL | -0.000000000499,-0.000000000164 |
21 |
qc_wave_c2_med |
this |
last_yr |
all
|
C2 coeff wavelength (microns/pix^2):: H_long/250 mas scale |
|
| |
|
*Data sources: QC1DB: QC1 database; LOCAL: local data source
|
