Plot
? |
Symb
? |
Source
* |
Average ? |
Thresholds ? |
N_
data |
QC1
parameter |
Data
downloads |
Remarks |
| method |
value |
unit |
method |
value |
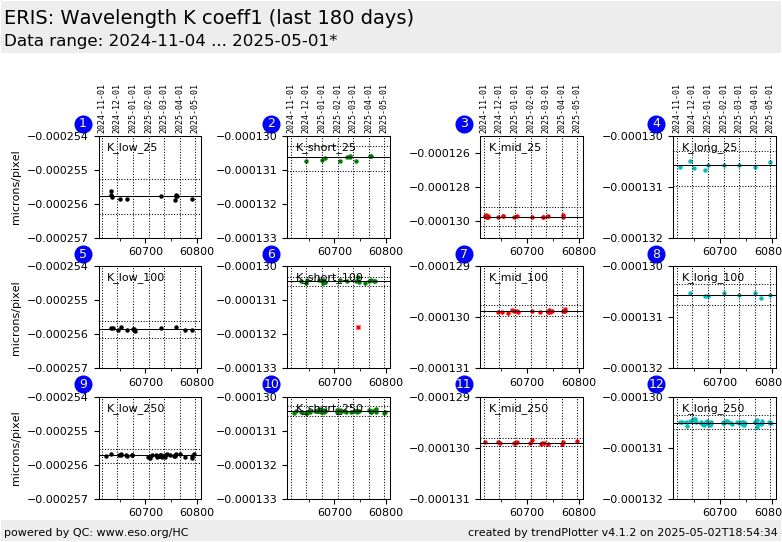
| 1 |
• | QC1DB |
MEDIAN |
-0.000256 |
microns/pixel |
VAL | -0.0002563,-0.00025526 |
18 |
qc_wave_c1_med |
this |
last_yr |
all
|
C1 coeff wavelength (microns/pixel):: K_low/25 mas scale |
| 2 |
• | QC1DB |
MEDIAN |
-0.000131 |
microns/pixel |
VAL | -0.000131028,-0.000130288 |
6 |
qc_wave_c1_med |
this |
last_yr |
all
|
C1 coeff wavelength (microns/pixel):: K_short/25 mas scale |
| 3 |
• | QC1DB |
MEDIAN |
-0.00013 |
microns/pixel |
VAL | -0.00013033,-0.00012918 |
9 |
qc_wave_c1_med |
this |
last_yr |
all
|
C1 coeff wavelength (microns/pixel):: K_middle/25 mas scale |
| 4 |
• | QC1DB |
MEDIAN |
-0.000131 |
microns/pixel |
VAL | -0.000130991,-0.000130304 |
13 |
qc_wave_c1_med |
this |
last_yr |
all
|
C1 coeff wavelength (microns/pixel):: K_long/25 mas scale |
|
| 5 |
• | QC1DB |
MEDIAN |
-0.000256 |
microns/pixel |
VAL | -0.000256117,-0.000255608 |
10 |
qc_wave_c1_med |
this |
last_yr |
all
|
C1 coeff wavelength (microns/pixel):: K_low/100 mas scale |
| 6 |
• | QC1DB |
MEDIAN |
-0.00013 |
microns/pixel |
VAL | -0.000130581,-0.000130314 |
6 |
qc_wave_c1_med |
this |
last_yr |
all
|
C1 coeff wavelength (microns/pixel):: K_short/100 mas scale |
| 7 |
• | QC1DB |
MEDIAN |
-0.00013 |
microns/pixel |
VAL | -0.000129985,-0.000129767 |
12 |
qc_wave_c1_med |
this |
last_yr |
all
|
C1 coeff wavelength (microns/pixel):: K_middle/100 mas scale |
| 8 |
• | QC1DB |
MEDIAN |
-0.000131 |
microns/pixel |
VAL | -0.000130764,-0.000130353 |
6 |
qc_wave_c1_med |
this |
last_yr |
all
|
C1 coeff wavelength (microns/pixel):: K_long/100 mas scale |
|
| 9 |
• | QC1DB |
MEDIAN |
-0.000256 |
microns/pixel |
VAL | -0.000255959,-0.000255527 |
19 |
qc_wave_c1_med |
this |
last_yr |
all
|
C1 coeff wavelength (microns/pixel):: K_low/250 mas scale |
| 10 |
• | QC1DB |
MEDIAN |
-0.00013 |
microns/pixel |
VAL | -0.00013057,-0.000130284 |
22 |
qc_wave_c1_med |
this |
last_yr |
all
|
C1 coeff wavelength (microns/pixel):: K_short/250 mas scale |
| 11 |
• | QC1DB |
MEDIAN |
-0.00013 |
microns/pixel |
VAL | -0.000129972,-0.000129816 |
9 |
qc_wave_c1_med |
this |
last_yr |
all
|
C1 coeff wavelength (microns/pixel):: K_middle/250 mas scale |
| 12 |
• | QC1DB |
MEDIAN |
-0.000131 |
microns/pixel |
VAL | -0.000130641,-0.000130368 |
24 |
qc_wave_c1_med |
this |
last_yr |
all
|
C1 coeff wavelength (microns/pixel):: K_long/250 mas scale |
|
| |
|
*Data sources: QC1DB: QC1 database; LOCAL: local data source
|
