Plot
? |
Symb
? |
Source
* |
Average ? |
Thresholds ? |
N_
data |
QC1
parameter |
Data
downloads |
Remarks |
| method |
value |
unit |
method |
value |
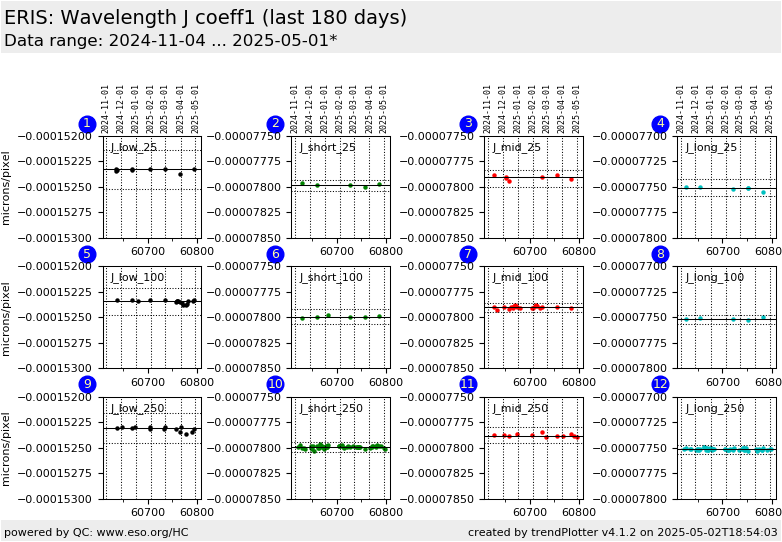
| 1 |
• | QC1DB |
MEDIAN |
-0.000152 |
microns/pixel |
VAL | -0.000152524,-0.000152137 |
9 |
qc_wave_c1_med |
this |
last_yr |
all
|
C1 coeff wavelength (microns/pixel):: J_low/25 mas scale |
| 2 |
• | QC1DB |
MEDIAN |
-7.8e-05 |
microns/pixel |
VAL | -0.00007804,-0.000077935 |
9 |
qc_wave_c1_med |
this |
last_yr |
all
|
C1 coeff wavelength (microns/pixel):: J_short/25 mas scale |
| 3 |
• | QC1DB |
MEDIAN |
-7.79e-05 |
microns/pixel |
VAL | -0.000077998,-0.000077835 |
8 |
qc_wave_c1_med |
this |
last_yr |
all
|
C1 coeff wavelength (microns/pixel):: J_middle/25 mas scale |
| 4 |
• | QC1DB |
MEDIAN |
-7.75e-05 |
microns/pixel |
VAL | -0.000077591,-0.000077423 |
6 |
qc_wave_c1_med |
this |
last_yr |
all
|
C1 coeff wavelength (microns/pixel):: J_long/25 mas scale |
|
| 5 |
• | QC1DB |
MEDIAN |
-0.000152 |
microns/pixel |
VAL | -0.000152478,-0.000152213 |
11 |
qc_wave_c1_med |
this |
last_yr |
all
|
C1 coeff wavelength (microns/pixel):: J_low/100 mas scale |
| 6 |
• | QC1DB |
MEDIAN |
-7.8e-05 |
microns/pixel |
VAL | -0.000078069,-0.000077917 |
7 |
qc_wave_c1_med |
this |
last_yr |
all
|
C1 coeff wavelength (microns/pixel):: J_short/100 mas scale |
| 7 |
• | QC1DB |
MEDIAN |
-7.79e-05 |
microns/pixel |
VAL | -0.0000779535,-0.0000778562 |
8 |
qc_wave_c1_med |
this |
last_yr |
all
|
C1 coeff wavelength (microns/pixel):: J_middle/100 mas scale |
| 8 |
• | QC1DB |
MEDIAN |
-7.75e-05 |
microns/pixel |
VAL | -0.0000775633,-0.0000774793 |
9 |
qc_wave_c1_med |
this |
last_yr |
all
|
C1 coeff wavelength (microns/pixel):: J_long/100 mas scale |
|
| 9 |
• | QC1DB |
MEDIAN |
-0.000152 |
microns/pixel |
VAL | -0.000152459,-0.000152161 |
16 |
qc_wave_c1_med |
this |
last_yr |
all
|
C1 coeff wavelength (microns/pixel):: J_low/250 mas scale |
| 10 |
• | QC1DB |
MEDIAN |
-7.8e-05 |
microns/pixel |
VAL | -0.0000780405,-0.0000779448 |
24 |
qc_wave_c1_med |
this |
last_yr |
all
|
C1 coeff wavelength (microns/pixel):: J_short/250 mas scale |
| 11 |
• | QC1DB |
MEDIAN |
-7.79e-05 |
microns/pixel |
VAL | -0.000077955,-0.000077795 |
10 |
qc_wave_c1_med |
this |
last_yr |
all
|
C1 coeff wavelength (microns/pixel):: J_middle/250 mas scale |
| 12 |
• | QC1DB |
MEDIAN |
-7.75e-05 |
microns/pixel |
VAL | -0.0000775597,-0.0000774727 |
16 |
qc_wave_c1_med |
this |
last_yr |
all
|
C1 coeff wavelength (microns/pixel):: J_long/250 mas scale |
|
| |
|
*Data sources: QC1DB: QC1 database; LOCAL: local data source
|
