mirror sites: PL (internal link) HQ     [?]

Health Check monitor


CAL | HC | QC
HealthCheck Monitor
   HOME | UsersGuide
  sl icon ALL INSTRUMENTS
 
all KPI reports
MATISSE:
Internal OPD
Other HC:
        [page auto-refreshes after 300 sec]   [stop | on]            [press Ctrl+Shift+R to enforce refresh of scores, dates and news]
MATISSE trending system: HEALTH CHECK report
HELP USERS-GUIDE MORE
Last update: 2026-04-16T20:21:05 (UT)
  | now: 2026-04-16T21:39:53 (UT) muc12 QC pipeline: matisse-2.0.2 (installed 2024-11-28)
same group: MAX_OPD OPD_LM OPD_N
General news: NOTE: The Health Check and calChecker services have been moved to qcFlow. These pages are only maintained for comparison and will be removed in 2026.
MATISSE news:  
Report news: 2021-09-28 the maximum OPD is calculated on the 6 baselines. Specifications mentioned a maximum shift of 100 microns/8h for MATISSE-LM and 300 for MATISSE-N. F [qc_matisse@eso.org]
DATE*: [?] 2026-04-09
report | NLT
2026-04-10
report | NLT
2026-04-11
report | NLT
2026-04-12
report | NLT
2026-04-13
report | NLT
2026-04-14
report | NLT
2026-04-15
report | NLT
2026-04-16
no data | NLT
r...
Raw CAL displays:
n/a n/a n/a n/a n/a n/a n/a no CAL raw files
P...
CAL product quality:
products products products products products products products no CAL products
 
transfer   ngas [?]

scores&comments | FULL | history ... | plot tutorial: n/a | contact | HC_docu... | quality events...                 daily/often; important to check     [?]
*Date on this monitor changes at 21:00 UT
png: Information and research:
- png file - advanced studies: QC1 browser | QC1 plotter
Plot
?
Symb
?
Source
*
Average ? Thresholds ? N_
data
QC1
parameter
Data
downloads
Remarks
method value unit method value
1 QC1DB MEDIAN 1.17 microns VAL0,28 92 max_opd this | last_yr | all Maximum OPD (6 baselines) - AQUARIUS (MATISSE-LM) - LOW OUT-OUT
2 QC1DB MEDIAN 0.969 microns VAL0,25 92 max_opd this | last_yr | all Maximum OPD (6 baselines) - AQUARIUS (MATISSE-LM) - LOW IN-IN
3 QC1DB MEDIAN 5.83 microns VAL0,28 90 max_opd this | last_yr | all Maximum OPD (6 baselines) - AQUARIUS (MATISSE-N) - LOW OUT-OUT
4 QC1DB MEDIAN 5.34 microns VAL0,25 90 max_opd this | last_yr | all Maximum OPD (6 baselines) - AQUARIUS (MATISSE-N) - LOW IN-IN
*Data sources: QC1DB: QC1 database; LOCAL: local data source
Plot 1
scores: 5|
data source:matisse_internal_vis
(QC1 database)
dataset:max_opd
median:1.17microns
fixed thresholds:0...28microns
N_data plotted:92
[click plot for closeup]
Plot 2
scores: no current data
data source:matisse_internal_vis_in_in
(QC1 database)
dataset:max_opd
median:0.969microns
fixed thresholds:0...25microns
N_data plotted:92
[click plot for closeup]
Plot 3
scores: 11|
data source:matisse_internal_vis
(QC1 database)
dataset:max_opd
median:5.83microns
fixed thresholds:0...28microns
N_data plotted:90
[click plot for closeup]
Plot 4
scores: no current data
data source:matisse_internal_vis_in_in
(QC1 database)
dataset:max_opd
median:5.34microns
fixed thresholds:0...25microns
N_data plotted:90
[click plot for closeup]
This plot

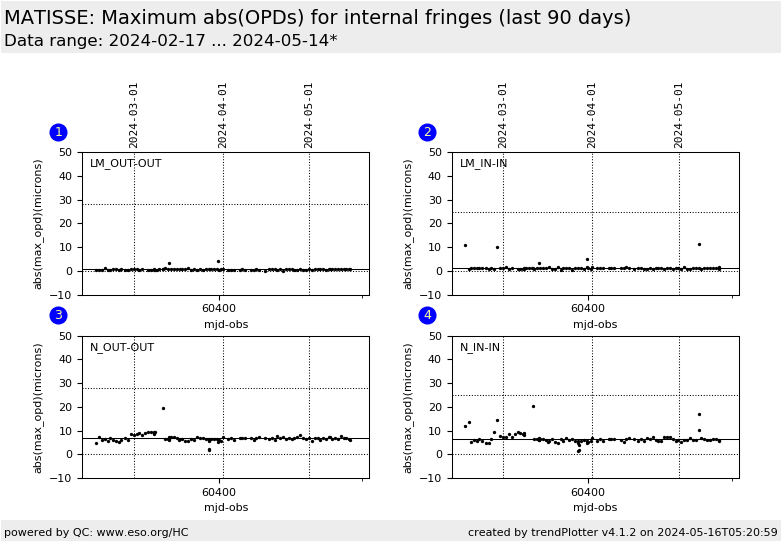
The averaged OPD is calculated per baseline for the different input raw files.
The maximum of the averaged OPD for the 6 baselines is plotted here.
Specifications are 100 microns/8h for MATISSE-LM and 300 for MATISSE-N.
The OPD must be stable to 20 microns to achieve less than 1% contrast loss during the night.
The max OPD for each baseline is plotted under OPD_LM and OPD_N (both for OUT-OUT and IN-IN configurations of the BCD)  


General information

Click on any of the plots to see a close-up version.

The latest date is indicated on top of the plot.

If configured,

  • data points belonging to the latest date are specially marked
  • statistical averages are indicated by a solid line, and thresholds by broken lines
  • outliers are marked by a red asterisk. They are defined as data points outside the threshold lines
  • "aliens" (= data points outside the plot Y limits) are marked by a red arrow ( or )
  • you can download the data for each parameter set if the 'Data downloads' link shows up