Plot
? |
Symb
? |
Source
* |
Average ? |
Thresholds ? |
N_
data |
QC1
parameter |
Data
downloads |
Remarks |
| method |
value |
unit |
method |
value |
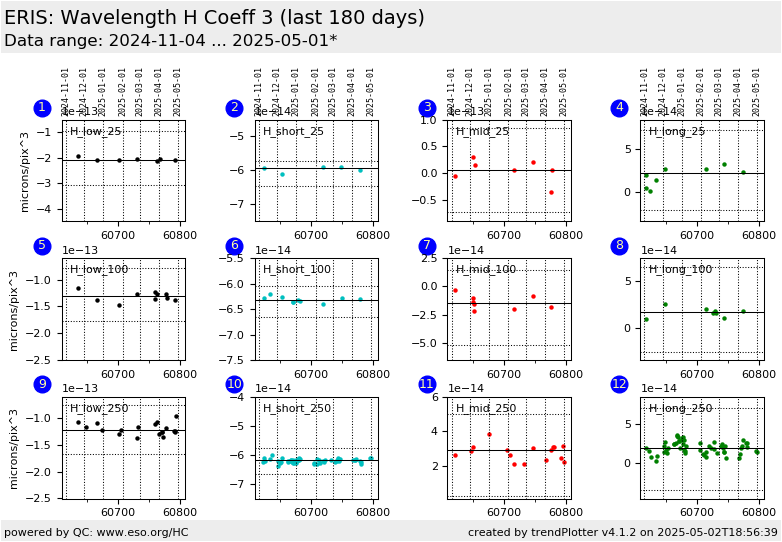
| 1 |
• | QC1DB |
MEDIAN |
-2.05e-13 |
microns/pix^3 |
VAL | -3.06000E-13,-9.60000E-14 |
10 |
qc_wave_c3_med |
this |
last_yr |
all
|
C3 coeff wavelength (microns/pix^3):: H_low/25 mas scale |
| 2 |
• | QC1DB |
MEDIAN |
-5.95e-14 |
microns/pix^3 |
VAL | -6.46700E-14,-5.73300E-14 |
5 |
qc_wave_c3_med |
this |
last_yr |
all
|
C3 coeff wavelength (microns/pix^3):: H_short/25 mas scale |
| 3 |
• | QC1DB |
MEDIAN |
4.9e-15 |
microns/pix^3 |
VAL | -7.20000E-14,8.50000E-14 |
7 |
qc_wave_c3_med |
this |
last_yr |
all
|
C3 coeff wavelength (microns/pix^3):: H_middle/25 mas scale |
| 4 |
• | QC1DB |
MEDIAN |
1.19e-14 |
microns/pix^3 |
VAL | -2.13000E-14,7.28000E-14 |
8 |
qc_wave_c3_med |
this |
last_yr |
all
|
C3 coeff wavelength (microns/pix^3):: H_long/25 mas scale |
|
| 5 |
• | QC1DB |
MEDIAN |
-1.32e-13 |
microns/pix^3 |
VAL | -1.77200E-13,-7.86000E-14 |
11 |
qc_wave_c3_med |
this |
last_yr |
all
|
C3 coeff wavelength (microns/pix^3):: H_low/100 mas scale |
| 6 |
• | QC1DB |
MEDIAN |
-6.29e-14 |
microns/pix^3 |
VAL | -6.66200E-14,-6.04800E-14 |
5 |
qc_wave_c3_med |
this |
last_yr |
all
|
C3 coeff wavelength (microns/pix^3):: H_short/100 mas scale |
| 7 |
• | QC1DB |
MEDIAN |
-2.03e-14 |
microns/pix^3 |
VAL | -5.16000E-14,1.42000E-14 |
6 |
qc_wave_c3_med |
this |
last_yr |
all
|
C3 coeff wavelength (microns/pix^3):: H_middle/100 mas scale |
| 8 |
• | QC1DB |
MEDIAN |
1.13e-14 |
microns/pix^3 |
VAL | -2.67000E-14,6.56000E-14 |
7 |
qc_wave_c3_med |
this |
last_yr |
all
|
C3 coeff wavelength (microns/pix^3):: H_long/100 mas scale |
|
| 9 |
• | QC1DB |
MEDIAN |
-1.21e-13 |
microns/pix^3 |
VAL | -1.67300E-13,-7.64000E-14 |
11 |
qc_wave_c3_med |
this |
last_yr |
all
|
C3 coeff wavelength (microns/pix^3):: H_low/250 mas scale |
| 10 |
• | QC1DB |
MEDIAN |
-6.15e-14 |
microns/pix^3 |
VAL | -6.67100E-14,-5.76900E-14 |
22 |
qc_wave_c3_med |
this |
last_yr |
all
|
C3 coeff wavelength (microns/pix^3):: H_short/250 mas scale |
| 11 |
• | QC1DB |
MEDIAN |
2.69e-14 |
microns/pix^3 |
VAL | 2.90000E-15,5.00000E-14 |
11 |
qc_wave_c3_med |
this |
last_yr |
all
|
C3 coeff wavelength (microns/pix^3):: H_middle/250 mas scale |
| 12 |
• | QC1DB |
MEDIAN |
1.81e-14 |
microns/pix^3 |
VAL | -3.40000E-14,7.10000E-14 |
23 |
qc_wave_c3_med |
this |
last_yr |
all
|
C3 coeff wavelength (microns/pix^3):: H_long/250 mas scale |
|
| |
|
*Data sources: QC1DB: QC1 database; LOCAL: local data source
|
