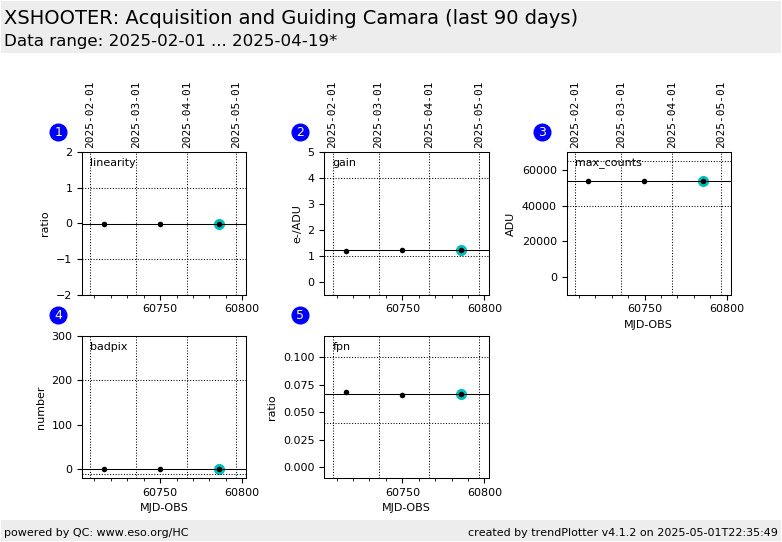
XSHOOTER trending system: HEALTH CHECK report
Last update: 2026-09-22T12:37:14 (UT)
[enable javascript for displaying time difference!]
General news:
NOTE: The Health Check and calChecker services have been moved to qcFlow. These pages are only maintained for comparison
and will be removed in 2026.
XSHOOTER news:
Updating of these XSHOOTER HC pages has been stopped. Please refer to the qcFlow Health Check. You can browse the full available trending history here.
Report news:
Plot? Symb? Source Average ? Thresholds ? N_ QC1 Data Remarks
method value unit method value
1
• QC1DB MEDIAN -0.0196 ratio VAL -1,1 4 non_linear
this |
last_yr |
all
2
• QC1DB MEDIAN 1.28 e-/ADU VAL 1,4 4 gain
this |
last_yr |
all
3
• QC1DB MEDIAN 5.3e+04 ADU VAL 40000,65000 4 max_count
this |
last_yr |
all
4
• QC1DB MEDIAN 0 number VAL -10,200 4 bad_pixels
this |
last_yr |
all
5
• QC1DB MEDIAN 0.0696 ratio VAL 0.04,0.1 4 fpn
this |
last_yr |
all
*Data sources: QC1DB: QC1 database; LOCAL: local data source
Plot 1 scores: 1 |
data source: xshooter_detmon dataset: non_linear • median: -0.0196 ratio fixed thresholds: -1...1 ratio N_data plotted: 4 [click plot for closeup]
Plot 2 scores: not implemented
data source: xshooter_detmon dataset: gain • median: 1.28 e-/ADU fixed thresholds: 1...4 e-/ADU N_data plotted: 4 [click plot for closeup]
Plot 3 scores: not implemented
data source: xshooter_detmon dataset: max_count • median: 5.3e+04 ADU fixed thresholds: 40000...65000 ADU N_data plotted: 4 [click plot for closeup]
Plot 4 scores: not implemented
data source: xshooter_detmon dataset: bad_pixels • median: 0 number fixed thresholds: -10...200 number N_data plotted: 4 [click plot for closeup]
Plot 5 scores: not implemented
data source: xshooter_detmon dataset: fpn • median: 0.0696 ratio fixed thresholds: 0.04...0.1 ratio N_data plotted: 4 [click plot for closeup]
General information
Click on any of the plots to see a close-up version .
The latest date is indicated on top of the plot.
If configured,
data points belonging to the latest date are specially marked statistical averages are indicated by a solid line, and thresholds by broken lines outliers are marked by a red asterisk. They are defined as data points outside the
threshold lines "aliens" (= data points outside the plot Y limits) are marked by a red arrow (↑ ↓ you can download the data for each parameter set if the 'Data downloads' link shows up
 mirror sites:
PL (internal
link) HQ
[?]
mirror sites:
PL (internal
link) HQ
[?]