
Using p2fc
Web Interface
Detailed Usage instructions
Just click the button... but where is it?
It requires just a simple button press in p2 to create a finding chart:
You can create finding charts for a single OB, multiply selected OBs (with Shift/Ctrl/Cmd-click of you mouse) or all the modifiable OBs in one or more containers, be it a single or multiple folder or Time-Link, Group or Concatenation container or even an entire run (but not for multiple runs at once...). Note that for runs and folders p2 will request FCs for all modifiable OBs in all containers, folders, sub-folders etc...
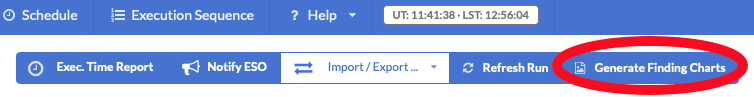
When a single run, folder or container is selected the "Generate Finding Charts" button is at the right hand end of the button bar just under the blue menu bar at the top of the window. You may need to resize your browser window to be wide enough to see it.
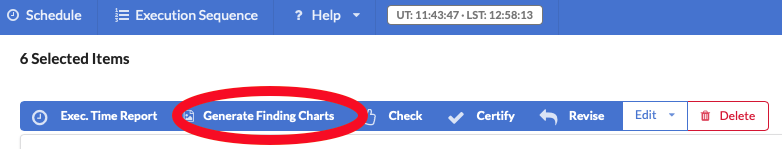
When multiple folders and/or containers and/or one or more OBs, or simply more than one OB, are selected the "Generate Finding Charts" button is 2nd from the left hand end of the button bar just under the blue menu bar at the top of the window. You may need to resize your browser window to be wide enogh to see it.
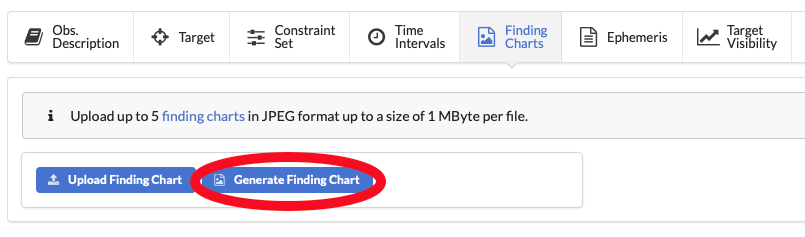
When considering a single OB, you must fist navigate to the "Finding Charts" tab of the OB, then the "Generate Finding Charts" button is found next to the "Upload Finding Charts" button...
Does my OB have enough free slots?
p2fc (currently) generates TWO (2) FCs per OB or THREE (3) FCs per OB with an associted Custom Background image. One, based on a DSS2-Red image, showing the field for the telescope guide star with possible guide stars labelled. The second shows a zoom-in on the field-of-view of the science instrument with an instrument and/or mode relevant backgrond image -- generally DSS2-Red image for visible-wavelength instruments and 2MASS or similar for IR instruments. You must therefore have either:
- At least two or three (2 or 3) free FC slots in the OB
- Or two or three (2 or 3) slots already occupied by p2fc generated FCs (in which case running p2fc again will OVERWRITE the existing p2fc generated FCs -- but not remove any NON p2fc generated FCs -- an FC is assumed to be p2fc generated if it's filename starts with "p2fc_ob<nnnnnn>"
Progress
Once you click the "Generate Finding Charts" button a popup window plus almost completely opaque black background will "fill" the screen. And there will be "spinners" to indicate "work in progress", both a global spinner for all OBs and an individual spinner for each OB.
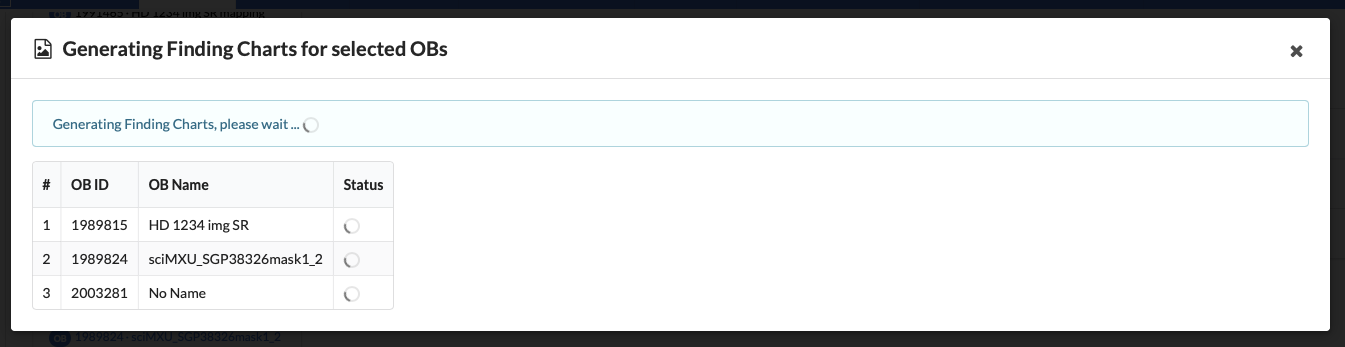
If you close the progress window before it is finished, you can go on with other p2 tasks, but there is then NO way to get back to the FC generation progress window. Either you have to trust that everything finishes OK, or you will have to check the FCs in each OB individually.
Results
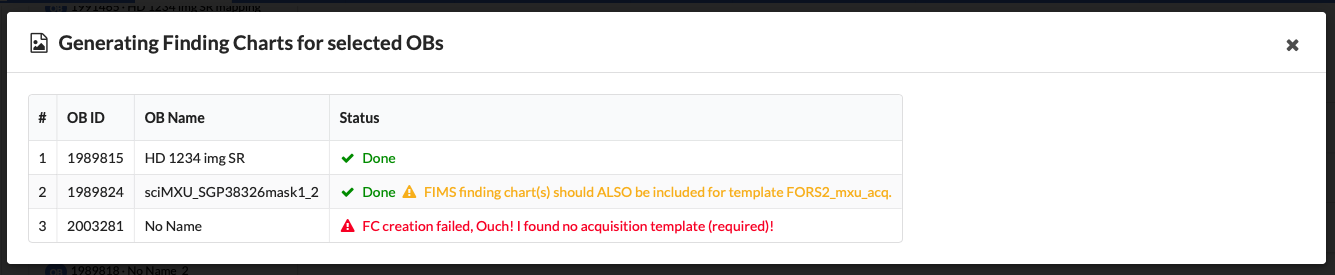
There are three possible outcomes
- Done: All ok, finding charts successfully created and attached to OB(s).
- Done, with warnings: finding charts successfully created and attached to OB(s) but some warnings were created (e.g. also attach FIMS charts, or no Guide star available)
- Error: finding charts FAILED to be made for some reason OR it took longer the 5mins to create the chart (see below for a more detailed explanation)
An example of each is presented in the following window.
OB(s) with p2fc generated FCs fail the Check
The OB Check process includes checks that any p2fc FC attached to a given OB correspond to that OB.
If you create an OB, and then generate and attach Finding Charts with p2fc, obviously that FC should ALWAYS pass the Check process.
But if you duplicate the OB, which includes duplicating the FC(s), and then modify the new OB, you may make the attached FC(s) invalid (it depends what you modify). If for example you change the exposure time, the FC(s) will still be valid, but if you change the target pointing, or the offset pattern or... then the FC(s) will probably be invalid. Simply run p2fc on those OBs again.
To be complete, if you duplicate an OB with p2fc FCs already attached, and make NO MODIFICATIONS, then you do NOT need to re-create the FCs in the new OB(s).
Known errors
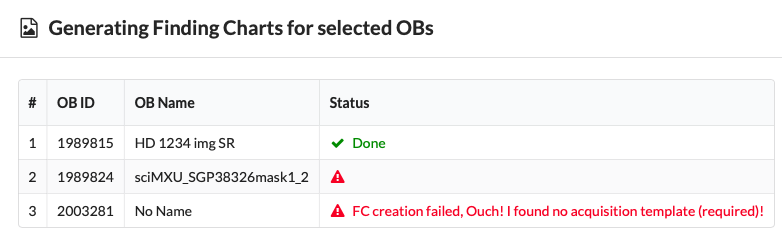
FC creation failed
If the error message begins with "FC creation failed", as in the screenshot above, this means that p2fc executed without problem (except see Resource temporarily unavailable below), but for some reason no FCs could be created. This maybe because of problems in the OB (e.g. no acquisition template, or because the instrument is not supported) in which case p2fc will always fail for that OB (unless you fix whatever the problem is) or it could actually be a bug in the p2fc code. In which case please create a ticket at support.eso.org.
! = timeout
When the only error "message" is a exclamation mark in a red triangle (see screenshot below), this usual means that your browser has timed out waiting for p2fc to finish (usually the timeout period is 5mins). This can happen for several reasons:
- p2fc server is busy: the p2fc server can make up to 64 FCs simultaneously -- though your browser will limit you to 6 simultaneously -- so if there are many users creating their FCs at the same time (e.g. 2hrs before the phase 2 deadline) it can be that FCs really do take more than 5mins to be created. Remember, as noted above, FCs take typically 10-40 seconds per OB, depending on the instrument, target, and how many other finding charts are being created on the server at the same time. In some cases it can take up to 2mins, and in VERY rare cases perhaps as much as 10mins, to create the finding charts for an OB. In this case, p2fc will (eventually) complete normally and attach the FCs to your OB(s). If after ~10-20mins the FCs have still not arrived in the OBs (don't forget to click the "Refresh OB" button) then just try submitting to p2fc the OB again.
- p2fc sub-process gets stuck: A small fraction of the time the p2fc sub-process creating a given OB just gets stuck (normally the other 63 keep running normally). In this case simply resubmit the OB to p2fc again.
- Uncaught exception: Some such cases may be caused by unknown bugs in the software that cause the sub-process creating a given OB to crash. Resubmitting the OB to p2fc again will just cause the same crash. In this case please create a ticket at support.eso.org and the software bug will be fixed in due course. In the meantime, attach your own custom finding charts.
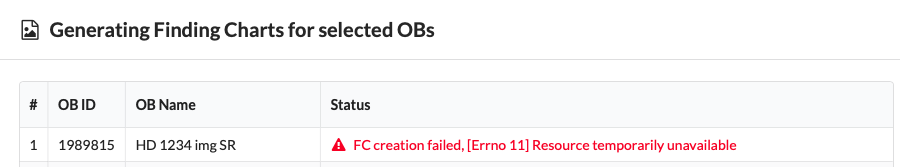
Resource temporarily unavailable
See screenshot below.
Command Line Interface
p2fc Finding Chart geneartion can be integrated into your own scripts via the (python) p2api method generateFindingChart, or you can generate p2fc finding charts from the command line using the p2api_generate_finding_charts command included in the p2api package. Please see the instructions in the Getting Started section of the p2api tutorial page for installing the p2api bindings.
The Web Interface is fully automated, there are no options to choose, you just press the button, wait a minute or three and it is done. The Command Line Interface allows a degree of control over the finding chart generation process. From the cmmand line you can control:
- The survey used, or use your own FITS file, as the background image
- Control the stretch, exponent, pmin and pmax parameters (see the APLpy show_grayscale documentation) that determine the display of the image
- If you select survey=GAIA, specifiy the IQ and noise background (which can be helpful in highlighting specific issues in particularly crowded fields that tend to get lost in the default p2fc FCs for the most extreme cases)
p2api
You can write your own python scripts to create and/or modify p2 OBs using the p2api, see the p2api tutorial here. The following short tutorial shows how to generate finding charts in a Python environment, and hence in your own scripts. It assumes you have installed the modue and are running an interactive session as per the p2api turorial page here. In particular, that you have done:
$ python
>>> import p2api
>>> api = p2api.ApiConnection('demo', '52052', 'tutorial')
>>> obId=1234567
Once you set obId to a valid OB id number, finding charts with default settings can then be generated (and attached to the OB) as follows:
>>> api.generateFindingChart( obId )
or more generally:
>>> api.generateFindingChart( obId, obs_date=None,
                         survey=None, bk_image=None, bk_lam=None,
                         stretch=None, pmin=None, pmax=None,
                         GAIA_im_IQ=None, GAIA_im_noise=None,
                       )
The available optional parameters are:
obs_date: string, e.g. '2019-10-11T04:03:02 UTC'
survey: string, one of:
['GAIA',
'DSS', 'DSS1 Blue', 'DSS1 Red', 'DSS2 Red', 'DSS2 Blue', 'DSS2 IR',
'SDSSg', 'SDSSi', 'SDSSr', 'SDSSu', 'SDSSz',
'SDSSdr7g', 'SDSSdr7i', 'SDSSdr7r', 'SDSSdr7u', 'SDSSdr7z',
'2MASS-J', '2MASS-H', '2MASS-K', 'UKIDSS-Y',
'UKIDSS-J', 'UKIDSS-H', 'UKIDSS-K'
]
bk_image: string, filename of local disk fits file, e.g. 'my_image.fits'
bk_lam: string, WL range of image, e.g. 'Custom filter [600-650nm]', or
        'V-band'
stretch: string, one of:
[‘linear’, ‘log’, ‘sqrt’, ‘arcsinh’, ‘power’]
exponent: float, e.g. 2.0
pmin: float, e.g. 0.1
pmax: float, e.g. 0.9
GAIA_im_IQ: float [arcsec], e.g. 0.3
GAIA_im_noise: float, e.g. 0.000001
The parameters survey and bk_image are mutually exclusive, if both are specified, survey is ignored and bk_image is used.
The full list of surveys currently supported by p2fc can be obtained with the command:
$ p2api_generate_finding_charts --supported_surveys
The parameter exponent is the exponent of the power law, and is only relevant if stretch='power',
otherwise it is ignored.
The stretch, exponent, pmin and pmax parameters are passed directly to the APLpy show_grayscale method, see the show_grayscale documentation for further information about them.
For GAIA pseudo images, 'noise' is added to obtain a more "realistic looking" image display. The noise is calculated via numpy random.normal function, with mean zero and scale GAIA_im_noise * max_pixel_value_of_brightest_star in the frame.
p2api_generate_finding_charts
The p2api_generate_finding_charts script is included in the p2api package and will be installed when the p2api package is installed.
If you install via MacPorts it will be located in /opt/local/bin and be named p2api_generate_finding_charts-<pyver> where <pyver> is the Python version the package has been installed for, e.g. p2api_generate_finding_charts-3.6.
If you instal via ESO Repository RPMs it will be located in /usr/bin and be named p2api_generate_finding_charts-<pyver>, e.g. p2api_generate_finding_charts-3.6.
If you make a user installation via pip, the script will be installed in ${HOME}/Library/Python/<pyver>/bin (macOS) or ${HOME}/.local/bin (Linux) and be called p2api_generate_finding_charts. If you make a system-wide installation via pip (NOT recommended) the script will be installed in /usr/bin/bin (macOS) or ${HOME}/.local/bin (Linux) and be called p2api_generate_finding_charts.
In the following it is understood that "p2api_generate_finding_charts" should be replaceed with "p2api_generate_finding_charts-<pyver>" as/if necessary.
Help can be displayed with the command:
$ p2api_generate_finding_charts -h
By default the script will access the production server (p2), but can be directed to access the demo p2 server via the command line option "--env demo".
A valid p2 username must be provided via the "-u <username>" command line option, unless accessing the demo p2 server.
FCs can then be generated for (and attached to) an OB on the demo or production p2 servers respectively as follows:
$ p2api_generate_finding_charts --env demo -i <obId>
$ p2api_generate_finding_charts --u <user> -i <obId>
Where <obId> is a valid OB ID, and <user> is a valid p2/ESO User Portal username. OB IDs can be read off the web interface.
FCs can be generated for (and attached to) all OBs in a container (e.g. a folder or a Concatenation, Group or TimeLink container) by replacing the obId with the containerId, i.e.:
$ p2api_generate_finding_charts --env demo -i <containerId>
$ p2api_generate_finding_charts --u <user> -i <containerId>
In the case of folders, the script will make an 'unlimited' recursive search for all OBs in the folder, any sub folder(s) or containers, i.e. every OB contained in the folder or any other container or folder below the specified folder containerId.
The available optional command line options are:
--obs_date: string, e.g. '2019-10-11T04:03:02 UTC'
--survey: string, one of:
['GAIA',
'DSS', 'DSS1 Blue', 'DSS1 Red', 'DSS2 Red', 'DSS2 Blue', 'DSS2 IR',
'SDSSg', 'SDSSi', 'SDSSr', 'SDSSu', 'SDSSz',
'SDSSdr7g', 'SDSSdr7i', 'SDSSdr7r', 'SDSSdr7u', 'SDSSdr7z',
'2MASS-J', '2MASS-H', '2MASS-K', 'UKIDSS-Y',
'UKIDSS-J', 'UKIDSS-H', 'UKIDSS-K'
]
--bk_image: string, filename of local disk fits file, e.g. 'my_image.fits'
--stretch: string, one of:
[‘linear’, ‘log’, ‘sqrt’, ‘arcsinh’, ‘power’]
--exponent: float, e.g. 2.0
--pmin: float, e.g. 0.1
--pmax: float, e.g. 0.9
--GAIA_im_IQ: float [arcsec], e.g. 0.3
--GAIA_im_noise: float, e.g. 0.000001
The command line options --survey and --bk_image are mutually exclusive, if both are specified, --survey is ignored and --bk_image is used.
The full list of surveys currently supported by p2fc can be obtained with the command:
$ p2api_generate_finding_charts --supported_surveys
The command line option --exponent is the exponent of the power law, and is only relevant if --stretch='power',
otherwise it is ignored.
The --stretch, --exponent, --pmin and --pmax command line options are passed directly to the APLpy show_grayscale method, see the show_grayscale documentation for further information about them.
For GAIA pseudo images, 'noise' is added to obtain a more "realistic looking" image display. The noise is calculated via numpy random.normal function, with mean zero and scale GAIA_im_noise * max_pixel_value_of_brightest_star in the frame.