
Forecast of Telescope Pressure
Telescope Demand
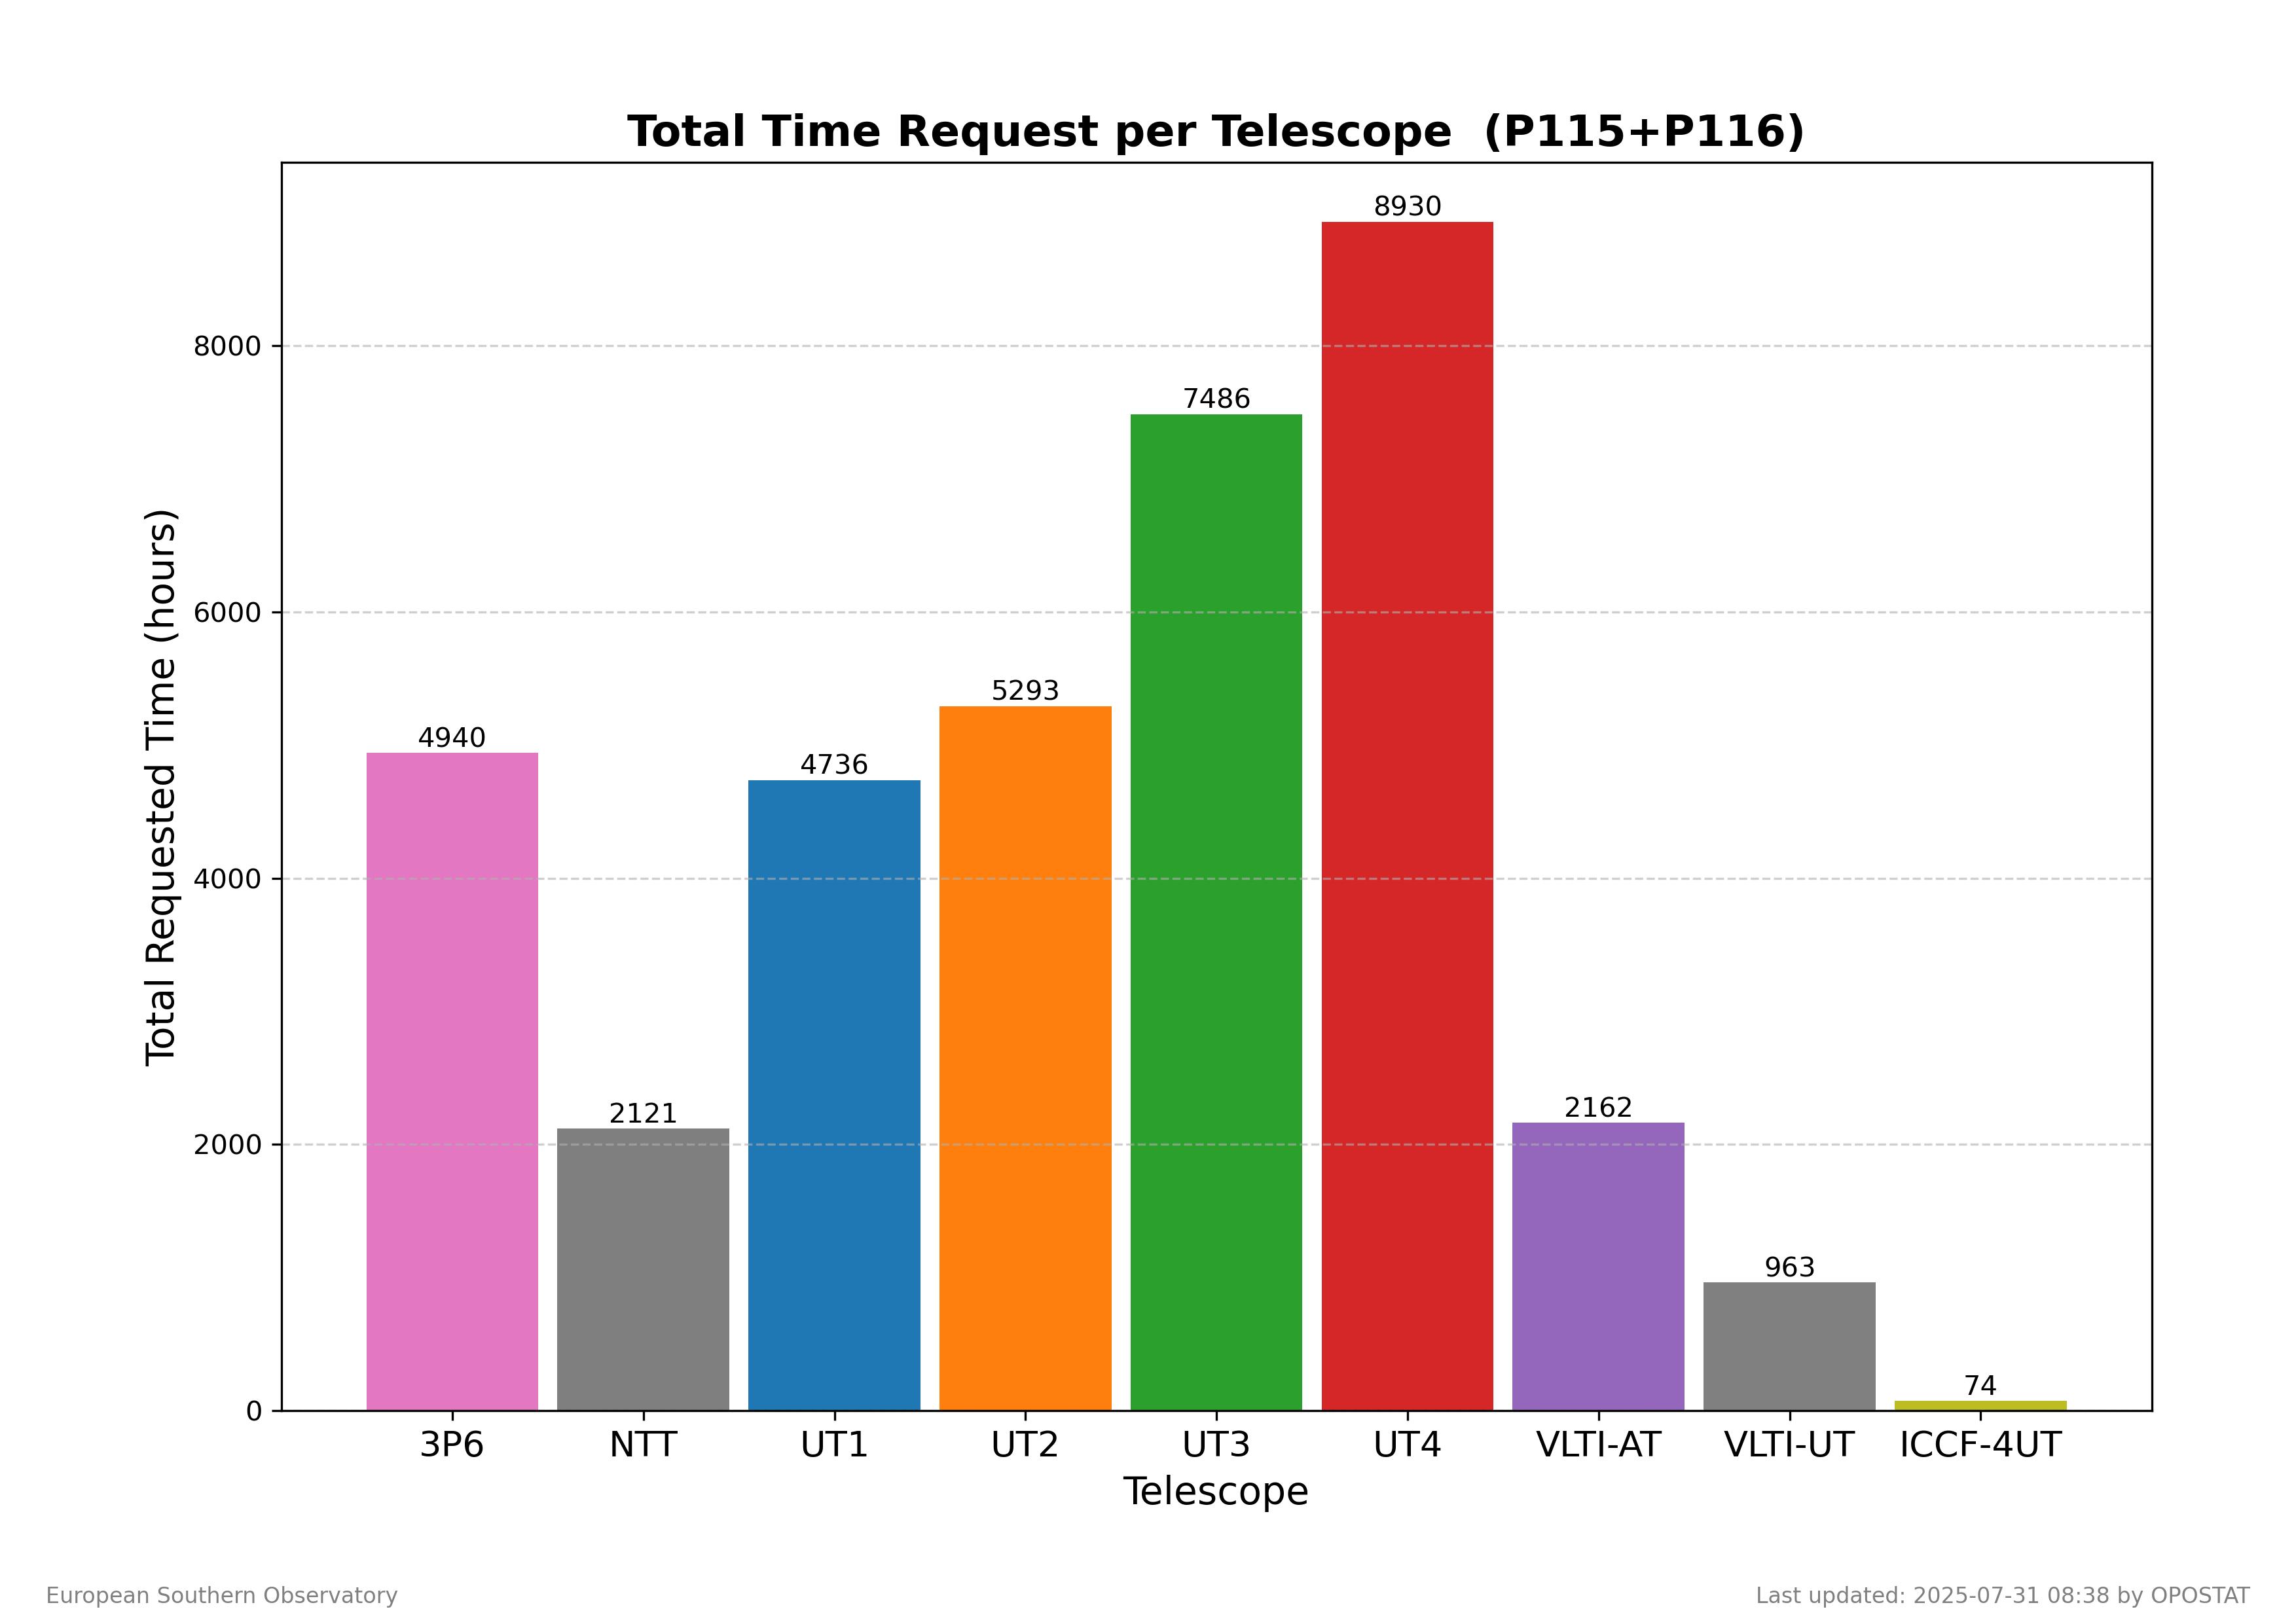
Figure 1: Average telescope time request over the past year (P115 and P116). The times included in the plot correspond to the runs requested in the given Periods by proposals submitted in the same Periods.
RA Distribution of Telescope Time Demand
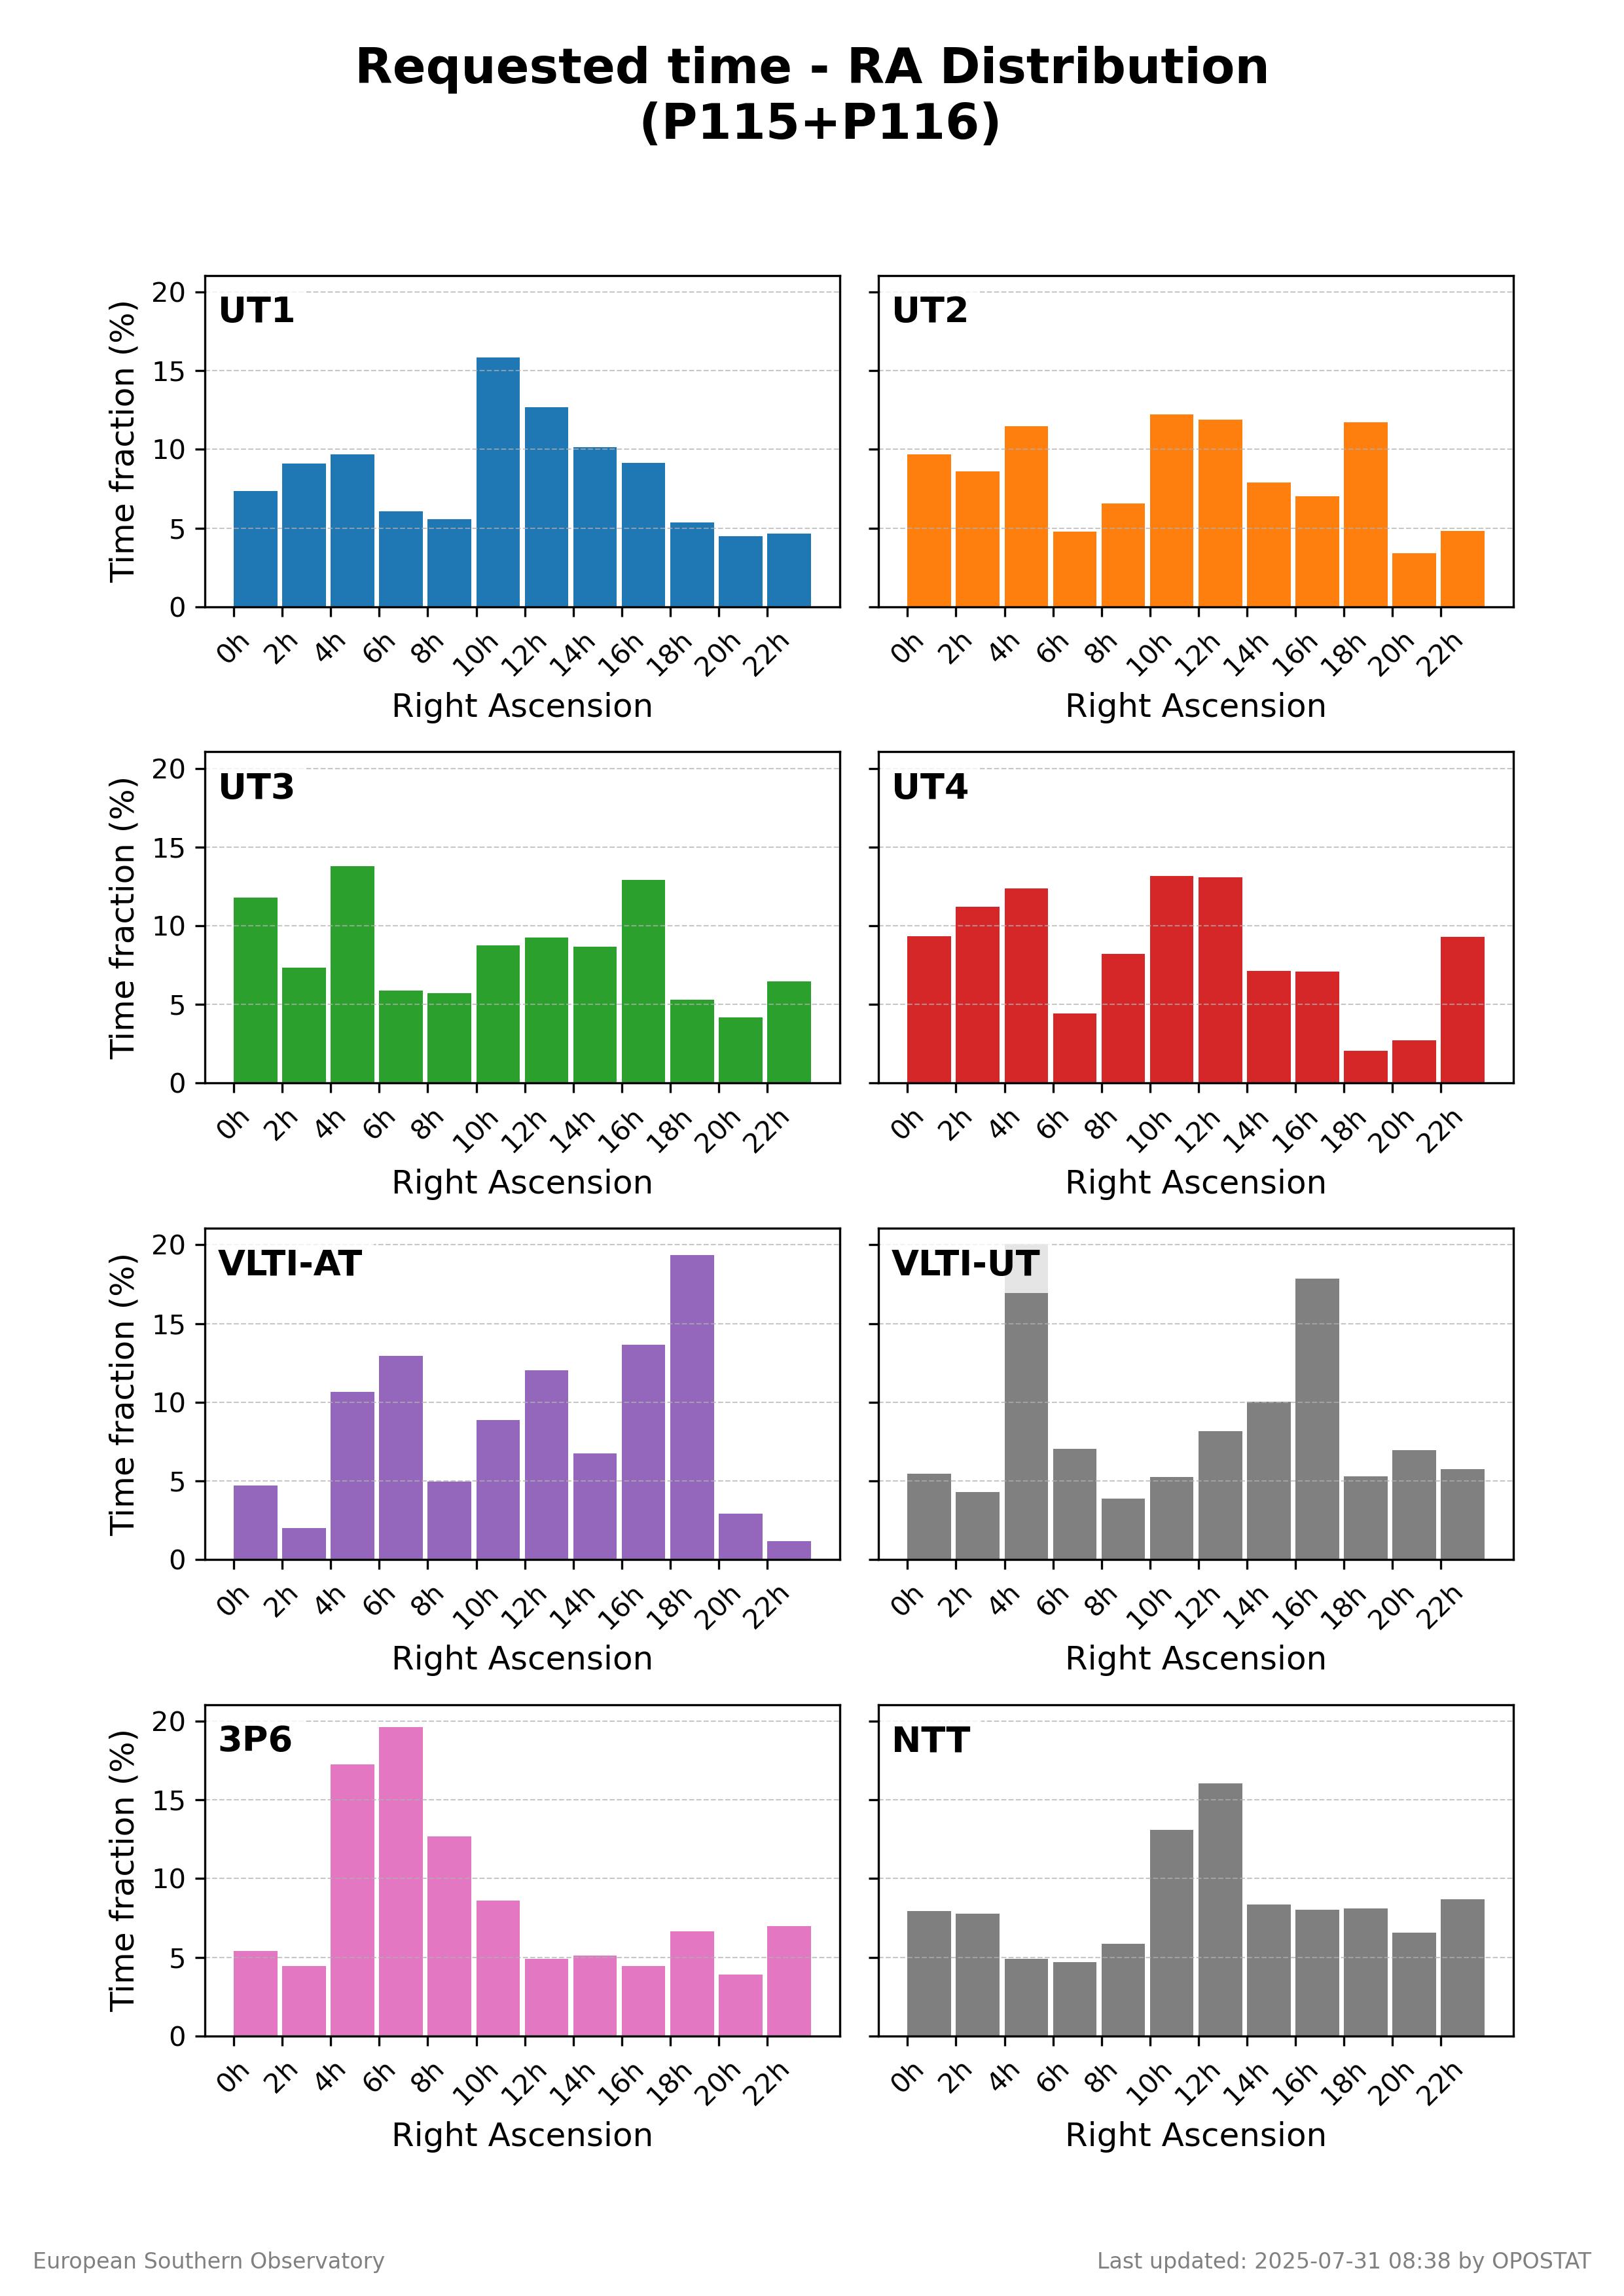
Figure 2: Prediction of the demand according to the RA distribution during the current period based on request over the last year (P115 and P116). For each telescope this is calculated as (100*TimeRA)/(TimeTotal). Note that requesting time for targets with visibility outside the current period can drastically reduce the chances of the run being scheduled.
The distribution of the demand in Right Ascension (RA) is not uniform throughout the year, and the probability that an OPC recommended run is successfully scheduled and completed depends on this pressure. Proposers are encouraged to read the article by Alves & Lombardi (2004, The ESO Messenger, 115, 15) on the sky distribution of VLT observations. In order to optimize the chances of time allocation, and to maximize the scientific return of the Observatory, proposers should be aware that choosing targets at certain RAs can have an enormous impact on the probability of successful scheduling and completion of their runs.
For the telescope scheduler, favourite sky regions are defined by a higher demand for observation time, i.e. increased competition for specific RAs. For example, there are only a limited number of photometric dark nights in March and April; on average 10 times less than the total requested by observers. A direct consequence of this is that only the top OPC ranked runs make it to the telescopes during these periods.
On the other hand, the opposite is true for August (RA~20:30) and January (RA~08:30); the time request for targets in the corresponding RA ranges tends to be relatively low, allowing a significantly higher fraction of runs applying for time at this RA to be scheduled (if considered useful by the OPC).
Based on the time request for all the ESO telescopes in the last year, one can make an educated guess of the RA demand expected during the current period. Proposers should take advantage of this information in choosing targets to maximize the probability of the allocation of time and successful execution of their runs.
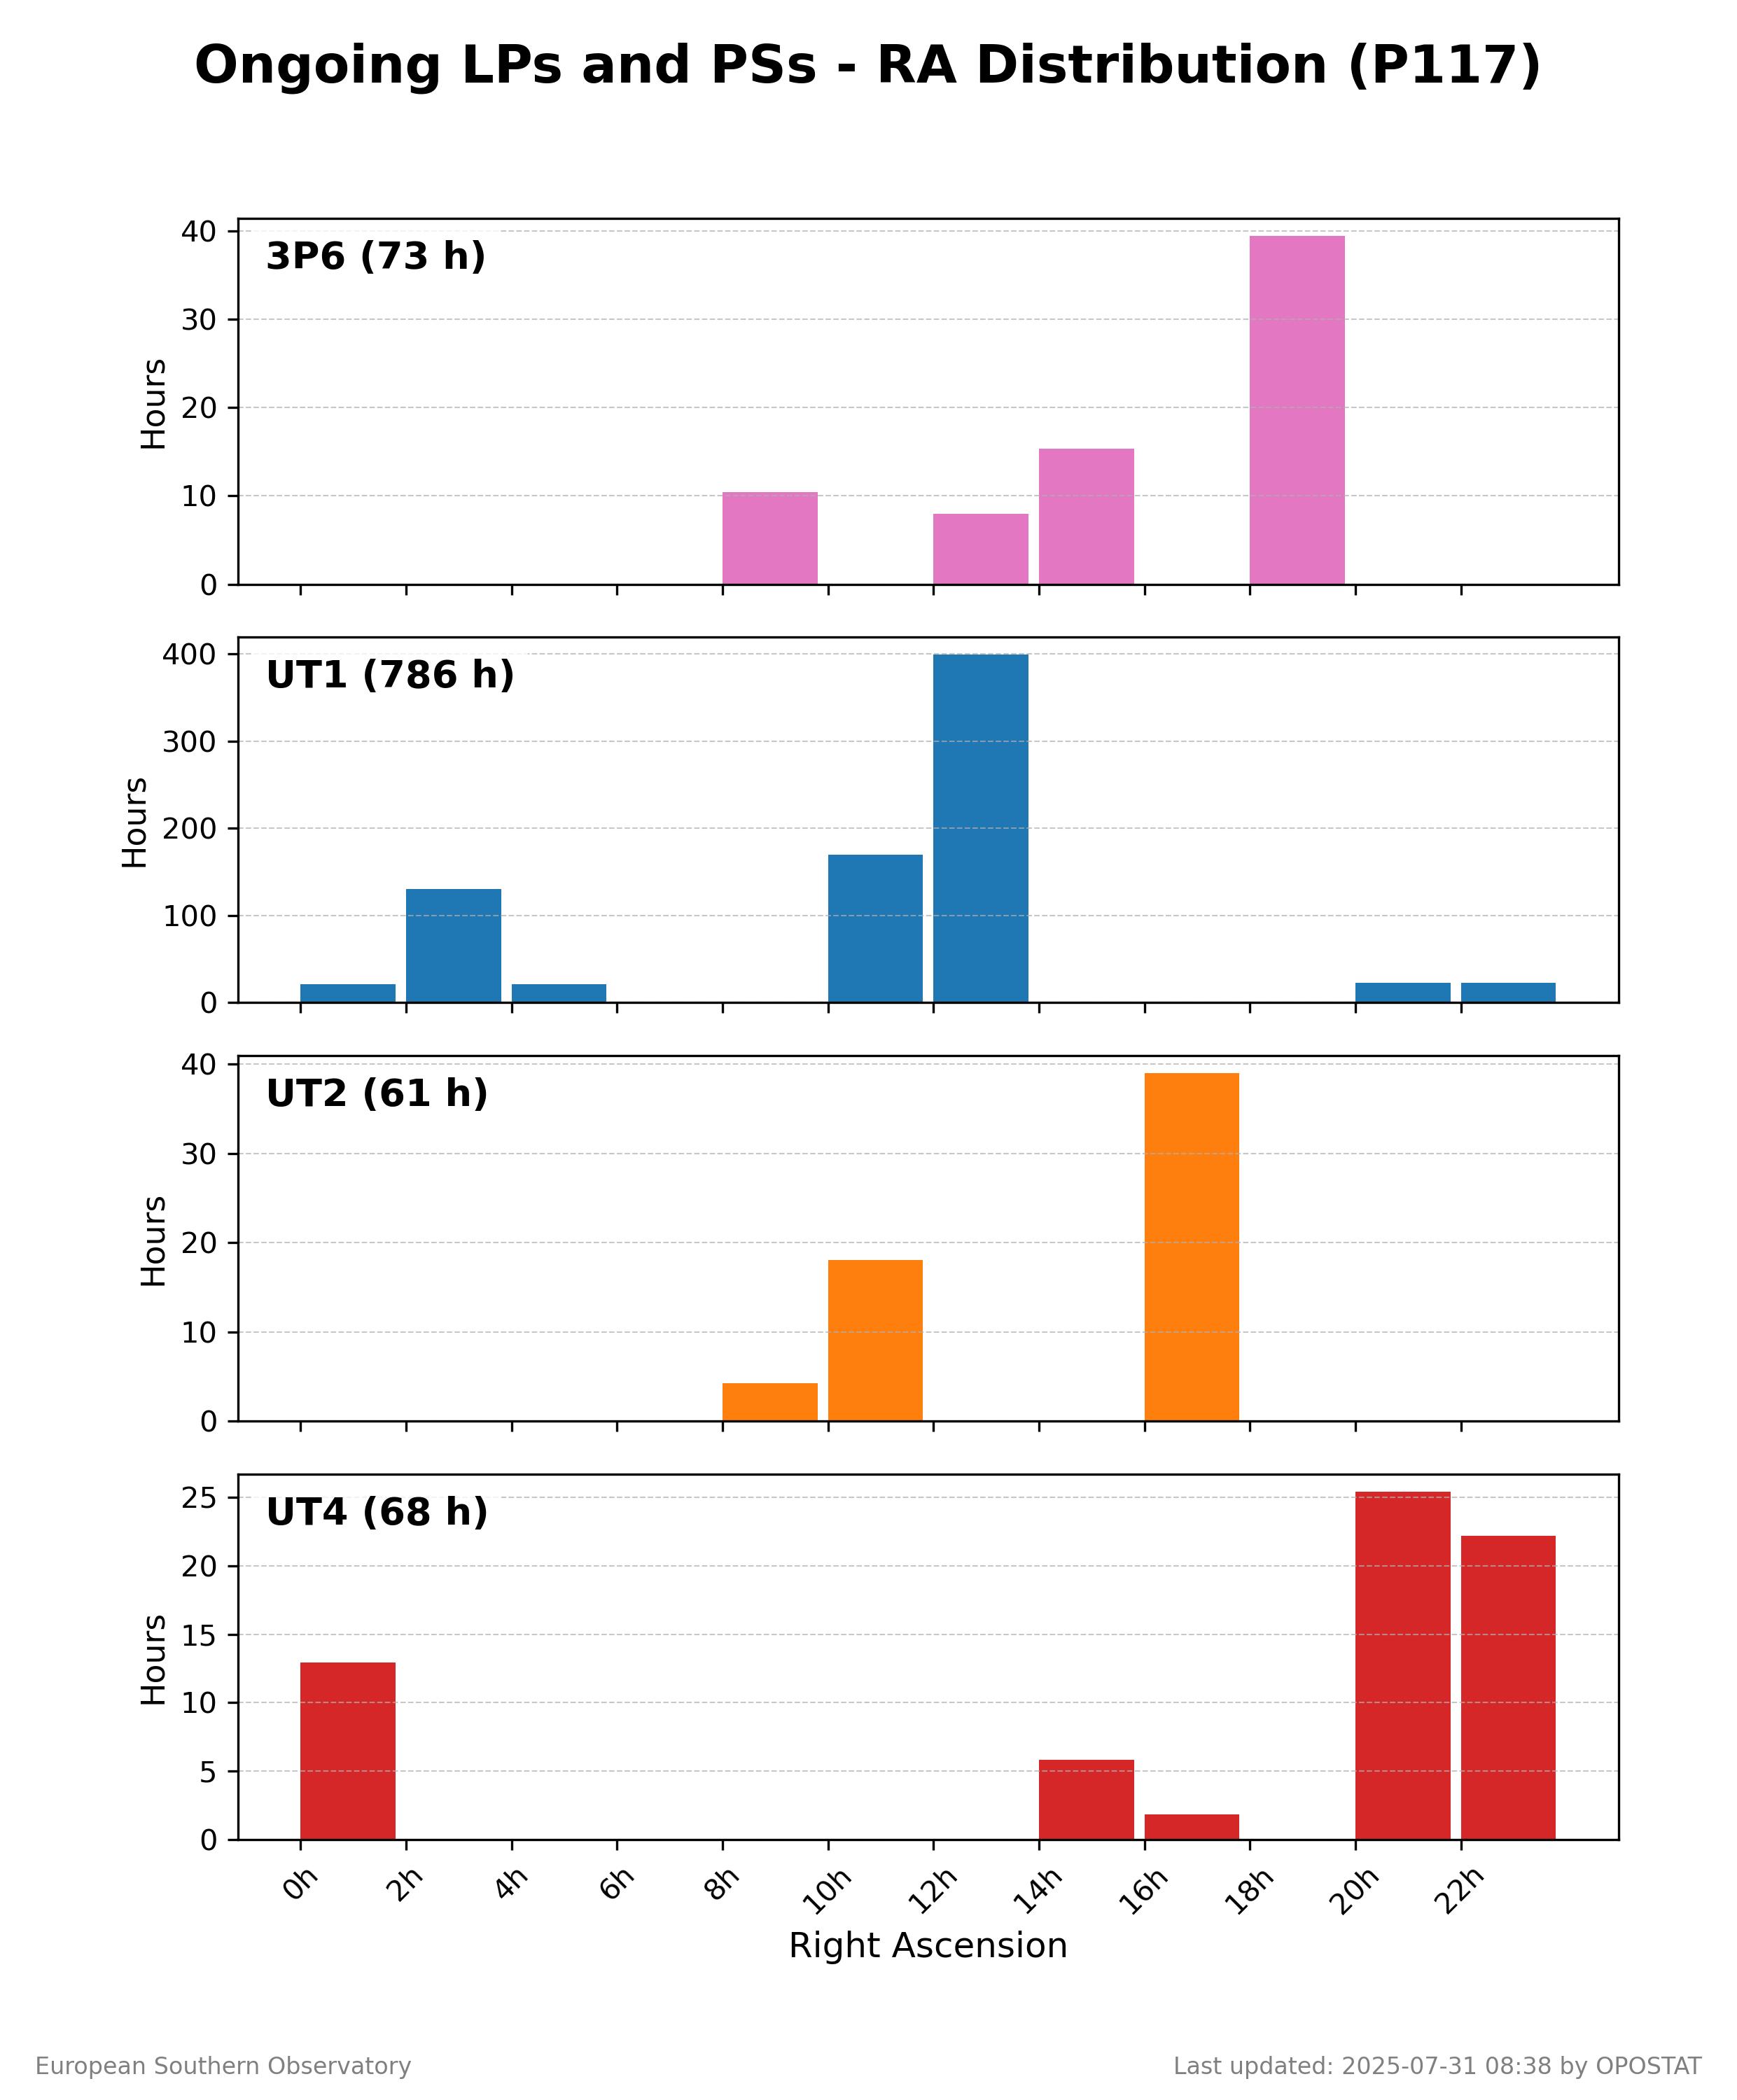
Figure 3: The expected time allocation (in hours) for ongoing Large Programmes in the current Period. Telescopes with no ongoing Large Programmes are not shown. This figure reports only the original requests as specified in the corresponding proposals. Possible carry-over or modifications in the final allocation are not taken into account.
Figure 4: Time request RA-DEC distribution map for Periods 115 and 116 for all offered ESO telescopes. The map binning is 10x10 degrees.