Plot
? |
Symb
? |
Source
* |
Average ? |
Thresholds ? |
N_
data |
QC1
parameter |
Data
downloads |
Remarks |
| method |
value |
unit |
method |
value |
| 1 |
• | QC1DB |
MEDIAN |
4.01 |
mJy/1hr |
none | |
64 |
sensit |
this |
last_yr |
all
|
sensitivity with PAH1 filter, pfov=0.0453 |
| 2 |
• | QC1DB |
MEDIAN |
5.45 |
mJy/1hr |
none | |
37 |
sensit |
this |
last_yr |
all
|
sensitivity with PAH2_2 filter, pfov=0.0453 |
| 3 |
• | QC1DB |
MEDIAN |
7.29 |
mJy/1hr |
none | |
6 |
sensit |
this |
last_yr |
all
|
sensitivity with ArIII filter, pfov=0.0453 |
| 4 |
• | QC1DB |
MEDIAN |
2.64 |
mJy/1hr |
none | |
4 |
sensit |
this |
last_yr |
all
|
sensitivity with J8.9 filter, pfov=0.0453 |
| 5 |
• | QC1DB |
MEDIAN |
3.67 |
mJy/1hr |
none | |
38 |
sensit |
this |
last_yr |
all
|
sensitivity with B10.7 filter, pfov=0.0453 |
| 6 |
• | QC1DB |
MEDIAN |
13.5 |
mJy/1hr |
none | |
38 |
sensit |
this |
last_yr |
all
|
sensitivity with NeII filter, pfov=0.0453 |
| |
|
*Data sources: QC1DB: QC1 database; LOCAL: local data source
|
Plot 1
scores: not implemented
| | data source: | visir_zp_img
(QC1 database) |
| dataset: | sensit | • |
| median: | 4.01 | mJy/1hr |
| thresholds: | none | |
| N_data plotted: | 64 |
| [click plot for closeup] |
Plot 2
scores: not implemented
| | data source: | visir_zp_img
(QC1 database) |
| dataset: | sensit | • |
| median: | 5.45 | mJy/1hr |
| thresholds: | none | |
| N_data plotted: | 37 |
| [click plot for closeup] |
Plot 3
scores: not implemented
| | data source: | visir_zp_img
(QC1 database) |
| dataset: | sensit | • |
| median: | 7.29 | mJy/1hr |
| thresholds: | none | |
| N_data plotted: | 6 |
| [click plot for closeup] |
Plot 4
scores: not implemented
| | data source: | visir_zp_img
(QC1 database) |
| dataset: | sensit | • |
| median: | 2.64 | mJy/1hr |
| thresholds: | none | |
| N_data plotted: | 4 |
| [click plot for closeup] |
Plot 5
scores: not implemented
| | data source: | visir_zp_img
(QC1 database) |
| dataset: | sensit | • |
| median: | 3.67 | mJy/1hr |
| thresholds: | none | |
| N_data plotted: | 38 |
| [click plot for closeup] |
Plot 6
scores: not implemented
| | data source: | visir_zp_img
(QC1 database) |
| dataset: | sensit | • |
| median: | 13.5 | mJy/1hr |
| thresholds: | none | |
| N_data plotted: | 38 |
| [click plot for closeup] |
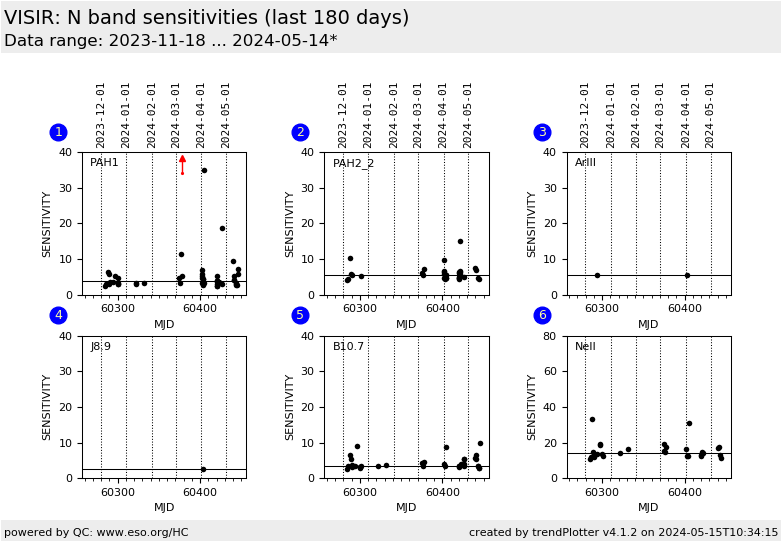
Measurements of the sensitivity parameter for several
N band filters. Note that starting with
P95 only small-field (SF) observations with 0.0453 arcsec/pixel
are offered.
Sensitivity is determined by observing a standard star and
estimating the limiting flux expected in 1 hour
"on-source" integration of a point-source detected with S/N of
10. It is given in units of mJy at 10 sigma in 1 hr.
General information
Click on any of the plots to see a close-up version.
The latest date is indicated on top of the plot.
If configured,
- data points belonging to the latest date are specially marked
- statistical averages are indicated by a solid line, and thresholds by broken lines
- outliers are marked by a red asterisk. They are defined as data points outside the
threshold lines
- "aliens" (= data points outside the plot Y limits) are marked by a red arrow (↑ or ↓)
- you can download the data for each parameter set if the 'Data downloads' link shows up
|
