mirror sites: PL (internal link) HQ     [?]

Health Check monitor


CAL | HC | QC
HealthCheck Monitor
   HOME | UsersGuide
  sl icon ALL INSTRUMENTS
 
all KPI reports
VISIR:
image quality
Other HC:
QC links:
        [page auto-refreshes after 300 sec]   [stop | on]            [press Ctrl+Shift+R to enforce refresh of scores, dates and news]
VISIR trending system: HEALTH CHECK report
HELP USERS-GUIDE MORE
Last update: 2026-04-17T02:02:44 (UT)
  | now: 2026-04-17T08:14:07 (UT) muc03 QC pipeline: visir-4.4.3 (installed 2023-04-27)
same group: IQ IQ_X_vs_Y   GAUSS_FWHM GAUSS_corr
General news: NOTE: The Health Check and calChecker services have been moved to qcFlow. These pages are only maintained for comparison and will be removed in 2026.
VISIR news:  
Report news:
DATE*: [?] 2026-04-10
report | NLT
2026-04-11
report | NLT
2026-04-12
report | NLT
2026-04-13
report | NLT
2026-04-14
report | NLT
2026-04-15
report | NLT
2026-04-16
no data | NLT
r...
Raw CAL displays:
raw raw raw raw raw raw no CAL raw files
P...
CAL product quality:
products products products products products products no CAL products
 
transfer   ngas [?]

scores&comments | history ... | plot tutorial ... | contact | HC_docu... | quality events...               [?]
*Date on this monitor changes at 21:00 UT
png: Information and research:
- png file - advanced studies: QC1 browser | QC1 plotter
Plot
?
Symb
?
Source
*
Average ? Thresholds ? N_
data
QC1
parameter
Data
downloads
Remarks
method value unit method value
1 QC1DB none   arcsec none  378 fwhmx this | last_yr | all FWHM_X in N band
1 QC1DB none   arcsec none  378 fwhmy this | last_yr | all FWHM_Y in N band
2 QC1DB none   arcsec none  89 fwhmx this | last_yr | all FWHM_X in Q band
2 QC1DB none   arcsec none  89 fwhmy this | last_yr | all FWHM_Y in Q band
3 QC1DB MEDIAN 0.349 arcsec none  378 fwhmy this | last_yr | all max(FWHM_X,FWHM_Y) in N band
4 QC1DB MEDIAN 0.483 arcsec none  89 fwhmy this | last_yr | all max(FWHM_X,FWHM_Y) in Q band
*Data sources: QC1DB: QC1 database; LOCAL: local data source
Plot 1
scores: not implemented
data source:visir_zp_img
(QC1 database)
dataset:
(numbers below apply to this dataset)
fwhmx
average:none
thresholds:none
N_data plotted:378
[click plot for closeup]
Plot 2
scores: not implemented
data source:visir_zp_img
(QC1 database)
dataset:
(numbers below apply to this dataset)
fwhmx
average:none
thresholds:none
N_data plotted:89
[click plot for closeup]
Plot 3
scores: not implemented
data source:visir_zp_img
(QC1 database)
dataset:fwhmy
median:0.349arcsec
thresholds:none 
N_data plotted:378
[click plot for closeup]
Plot 4
scores: not implemented
data source:visir_zp_img
(QC1 database)
dataset:fwhmy
median:0.483arcsec
thresholds:none 
N_data plotted:89
[click plot for closeup]
This plot

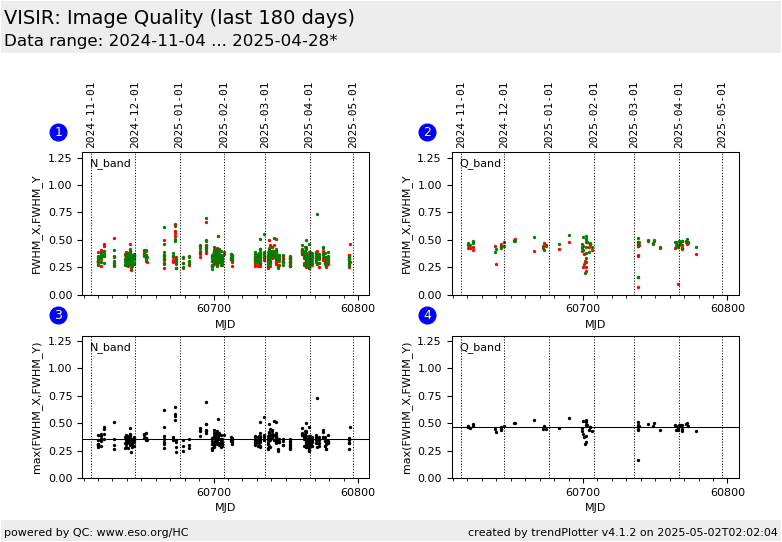
Measurements of the image quality from imaging standard star observations. Values are currently determined as FWHM in X and Y direction. Pipeline values are in pixels which have been converted to arcsecs using the pixel field-of-view of 0.0453 arcsec/px.  


General information

Click on any of the plots to see a close-up version.

The latest date is indicated on top of the plot.

If configured,

  • data points belonging to the latest date are specially marked
  • statistical averages are indicated by a solid line, and thresholds by broken lines
  • outliers are marked by a red asterisk. They are defined as data points outside the threshold lines
  • "aliens" (= data points outside the plot Y limits) are marked by a red arrow ( or )
  • you can download the data for each parameter set if the 'Data downloads' link shows up