Plot
? |
Symb
? |
Source
* |
Average ? |
Thresholds ? |
N_
data |
QC1
parameter |
Data
downloads |
Remarks |
| method |
value |
unit |
method |
value |
| 1 |
• | QC1DB |
MEDIAN |
2.35e+04 |
ADU/Jy |
none | |
33 |
conver |
this |
last_yr |
all
|
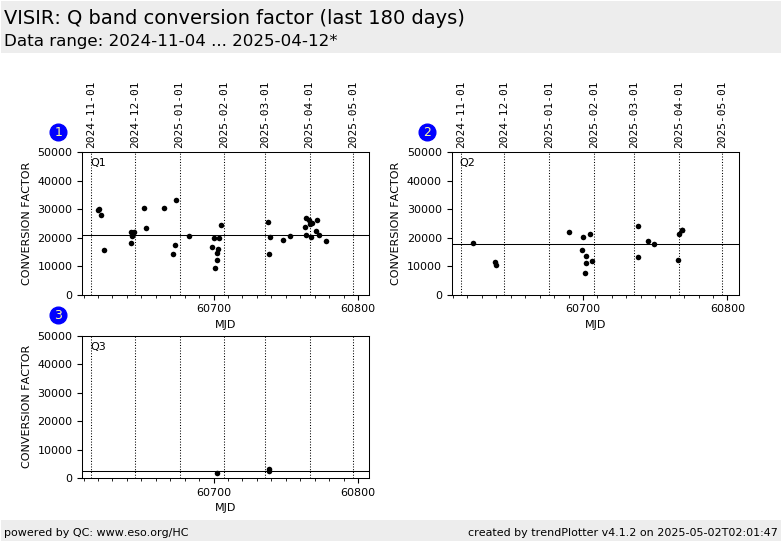
conversion factor with Q1 filter, pfov=0.0453 |
| 2 |
• | QC1DB |
MEDIAN |
2.32e+04 |
ADU/Jy |
none | |
9 |
conver |
this |
last_yr |
all
|
conversion factor with Q2 filter, pfov=0.0453 |
| 3 |
• | QC1DB |
MEDIAN |
4.26e+03 |
ADU/Jy |
none | |
5 |
conver |
this |
last_yr |
all
|
conversion factor with Q3 filter, pfov=0.0453 |
| |
|
*Data sources: QC1DB: QC1 database; LOCAL: local data source
|
Plot 1
scores: not implemented
| | data source: | visir_zp_img
(QC1 database) |
| dataset: | conver | • |
| median: | 2.35e+04 | ADU/Jy |
| thresholds: | none | |
| N_data plotted: | 33 |
| [click plot for closeup] |
Plot 2
scores: not implemented
| | data source: | visir_zp_img
(QC1 database) |
| dataset: | conver | • |
| median: | 2.32e+04 | ADU/Jy |
| thresholds: | none | |
| N_data plotted: | 9 |
| [click plot for closeup] |
Plot 3
scores: not implemented
| | data source: | visir_zp_img
(QC1 database) |
| dataset: | conver | • |
| median: | 4.26e+03 | ADU/Jy |
| thresholds: | none | |
| N_data plotted: | 5 |
| [click plot for closeup] |
Measurements of the conversion factor from imaging standard star
observations. The three Q band filters are shown. Note that starting with
P95 only small-field (SF) observations with 0.0453 arcsec/pixel
are offered.
The conversion factor describes the conversion between ADU and Jy. It is
computed as: F(tot.observed) / F(model) [ADU/Jy], where F corresponds
to flux and F(model) is the model predicted flux of the standard star
from a catalog.
General information
Click on any of the plots to see a close-up version.
The latest date is indicated on top of the plot.
If configured,
- data points belonging to the latest date are specially marked
- statistical averages are indicated by a solid line, and thresholds by broken lines
- outliers are marked by a red asterisk. They are defined as data points outside the
threshold lines
- "aliens" (= data points outside the plot Y limits) are marked by a red arrow (↑ or ↓)
- you can download the data for each parameter set if the 'Data downloads' link shows up
|
