Plot
? |
Symb
? |
Source
* |
Average ? |
Thresholds ? |
N_
data |
QC1
parameter |
Data
downloads |
Remarks |
| method |
value |
unit |
method |
value |
| 1 |
• | QC1DB |
MEDIAN |
0.00924 |
ADU |
none | |
89 |
trace_slice_l_tilt |
this |
last_yr |
all
|
average for all IFUs |
| 2 |
• | QC1DB |
MEDIAN |
0.012 |
ADU |
none | |
89 |
trace_slice_l_tilt |
this |
last_yr |
all
|
rms for all IFUs |
| 3 |
• | QC1DB |
MEDIAN |
0.00924 |
ADU |
none | |
89 |
trace_slice_l_tilt |
this |
last_yr |
all
|
average for all IFUs |
| 4 |
• | QC1DB |
MEDIAN |
0.0437 |
ADU |
none | |
89 |
trace_slice_r_tilt |
this |
last_yr |
all
|
average for all IFUs |
| 5 |
• | QC1DB |
MEDIAN |
0.0133 |
ADU |
none | |
89 |
trace_slice_r_tilt |
this |
last_yr |
all
|
rms for all IFUs |
| 6 |
• | QC1DB |
MEDIAN |
0.0437 |
ADU |
none | |
89 |
trace_slice_r_tilt |
this |
last_yr |
all
|
average for all IFUs |
| |
|
*Data sources: QC1DB: QC1 database; LOCAL: local data source
|
Plot 1
scores: no current data
| | data source: | muse_tracetable
(QC1 database) |
| dataset: | trace_slice_l_tilt | • |
| median: | 0.00924 | ADU |
| thresholds: | none | |
| N_data plotted: | 89 |
| [click plot for closeup] |
Plot 2
scores: no current data
| | data source: | muse_tracetable
(QC1 database) |
| dataset: | trace_slice_l_tilt | • |
| median: | 0.012 | ADU |
| thresholds: | none | |
| N_data plotted: | 89 |
| [click plot for closeup] |
Plot 3
scores: not implemented
| | data source: | muse_tracetable
(QC1 database) |
| dataset: | trace_slice_l_tilt | • |
| median: | 0.00924 | ADU |
| thresholds: | none | |
| N_data plotted: | 89 |
| [click plot for closeup] |
Plot 4
scores: no current data
| | data source: | muse_tracetable
(QC1 database) |
| dataset: | trace_slice_r_tilt | • |
| median: | 0.0437 | ADU |
| thresholds: | none | |
| N_data plotted: | 89 |
| [click plot for closeup] |
Plot 5
scores: no current data
| | data source: | muse_tracetable
(QC1 database) |
| dataset: | trace_slice_r_tilt | • |
| median: | 0.0133 | ADU |
| thresholds: | none | |
| N_data plotted: | 89 |
| [click plot for closeup] |
Plot 6
scores: not implemented
| | data source: | muse_tracetable
(QC1 database) |
| dataset: | trace_slice_r_tilt | • |
| median: | 0.0437 | ADU |
| thresholds: | none | |
| N_data plotted: | 89 |
| [click plot for closeup] |
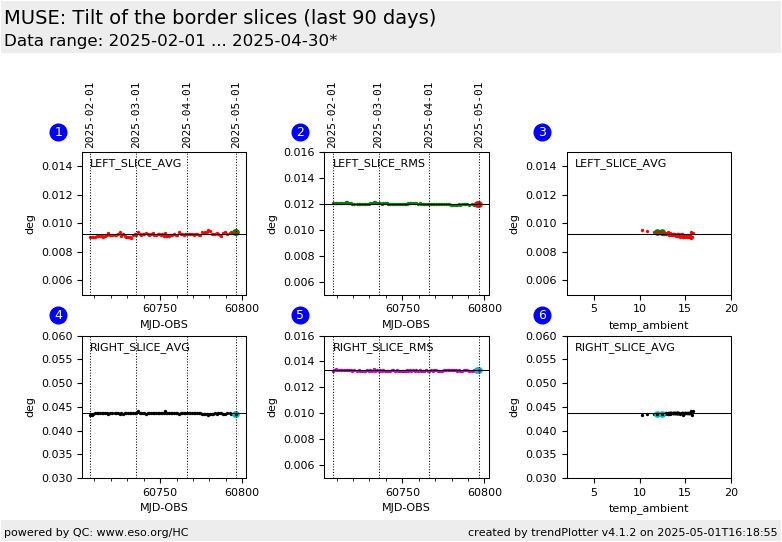
This is MUSE TRACE_tilt health check plot. It shows tilt [deg],
measured as angle from vertical direction, of the left-most and
right-most slice, averaged across all the IFUs (CHANels). Only data
points extracted from LAMP_FLAT calibrations taken in the instrumental mode
(INS.MODE) WFM-NOAO-E and the read out mode (DET.READ.CURNAME)
SCI1.0 are selected.
The LAMP_FLAT calibration data are taken with template TPL.ID=MUSE_wfm_cal_specflat
General information
Click on any of the plots to see a close-up version.
The latest date is indicated on top of the plot.
If configured,
- data points belonging to the latest date are specially marked
- statistical averages are indicated by a solid line, and thresholds by broken lines
- outliers are marked by a red asterisk. They are defined as data points outside the
threshold lines
- "aliens" (= data points outside the plot Y limits) are marked by a red arrow (↑ or ↓)
- you can download the data for each parameter set if the 'Data downloads' link shows up
|
