Plot
? |
Symb
? |
Source
* |
Average ? |
Thresholds ? |
N_
data |
QC1
parameter |
Data
downloads |
Remarks |
| method |
value |
unit |
method |
value |
| 1 |
• | QC1DB |
MEDIAN |
63.1 |
pix |
none | |
50 |
trace_slice_l_xpos |
this |
last_yr |
all
|
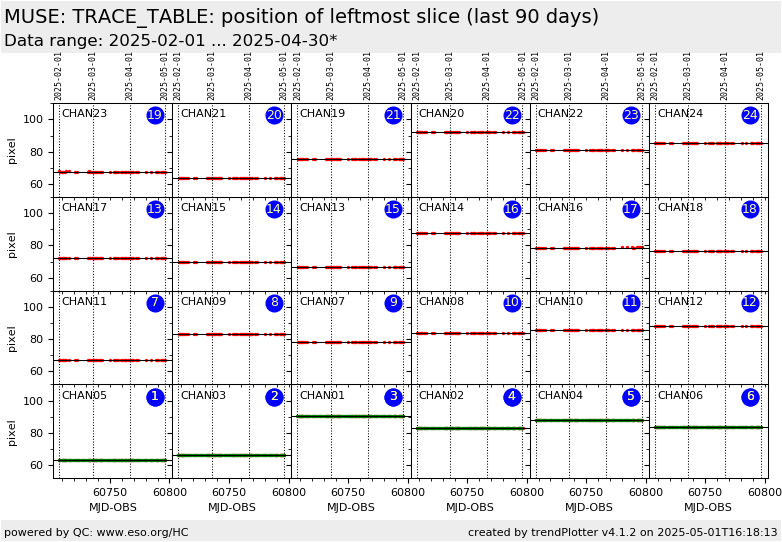
position of leftmost slice for CHAN05 |
| 1 |
• | QC1DB |
MEDIAN |
63.1 |
pix |
none | |
89 |
trace_slice_l_xpos |
this |
last_yr |
all
|
position of leftmost slice for CHAN05, WFM-NOAO-E |
| 2 |
• | QC1DB |
MEDIAN |
66.2 |
pix |
none | |
50 |
trace_slice_l_xpos |
this |
last_yr |
all
|
position of leftmost slice for CHAN03 |
| 2 |
• | QC1DB |
MEDIAN |
66.2 |
pix |
none | |
89 |
trace_slice_l_xpos |
this |
last_yr |
all
|
position of leftmost slice for CHAN03, WFM-NOAO-E |
| 3 |
• | QC1DB |
MEDIAN |
90.6 |
pix |
none | |
50 |
trace_slice_l_xpos |
this |
last_yr |
all
|
position of leftmost slice for CHAN01 |
| 3 |
• | QC1DB |
MEDIAN |
90.6 |
pix |
none | |
89 |
trace_slice_l_xpos |
this |
last_yr |
all
|
position of leftmost slice for CHAN01, WFM-NOAO-E |
| 4 |
• | QC1DB |
MEDIAN |
83.1 |
pix |
none | |
50 |
trace_slice_l_xpos |
this |
last_yr |
all
|
position of leftmost slice for CHAN02 |
| 4 |
• | QC1DB |
MEDIAN |
83.1 |
pix |
none | |
89 |
trace_slice_l_xpos |
this |
last_yr |
all
|
position of leftmost slice for CHAN02, WFM-NOAO-E |
| 5 |
• | QC1DB |
MEDIAN |
88 |
pix |
none | |
50 |
trace_slice_l_xpos |
this |
last_yr |
all
|
position of leftmost slice for CHAN04 |
| 5 |
• | QC1DB |
MEDIAN |
88 |
pix |
none | |
89 |
trace_slice_l_xpos |
this |
last_yr |
all
|
position of leftmost slice for CHAN04, WFM-NOAO-E |
| 6 |
• | QC1DB |
MEDIAN |
83.6 |
pix |
none | |
50 |
trace_slice_l_xpos |
this |
last_yr |
all
|
position of leftmost slice for CHAN06 |
| 6 |
• | QC1DB |
MEDIAN |
83.6 |
pix |
none | |
89 |
trace_slice_l_xpos |
this |
last_yr |
all
|
position of leftmost slice for CHAN06, WFM-NOAO-E |
| 7 |
• | QC1DB |
MEDIAN |
67 |
pix |
none | |
50 |
trace_slice_l_xpos |
this |
last_yr |
all
|
position of leftmost slice for CHAN11 |
| 8 |
• | QC1DB |
MEDIAN |
83 |
pix |
none | |
50 |
trace_slice_l_xpos |
this |
last_yr |
all
|
position of leftmost slice for CHAN09 |
| 9 |
• | QC1DB |
MEDIAN |
78.4 |
pix |
none | |
50 |
trace_slice_l_xpos |
this |
last_yr |
all
|
position of leftmost slice for CHAN07 |
| 10 |
• | QC1DB |
MEDIAN |
83.7 |
pix |
none | |
50 |
trace_slice_l_xpos |
this |
last_yr |
all
|
position of leftmost slice for CHAN08 |
| 11 |
• | QC1DB |
MEDIAN |
85.5 |
pix |
none | |
50 |
trace_slice_l_xpos |
this |
last_yr |
all
|
position of leftmost slice for CHAN10 |
| 12 |
• | QC1DB |
MEDIAN |
88.3 |
pix |
none | |
50 |
trace_slice_l_xpos |
this |
last_yr |
all
|
position of leftmost slice for CHAN12 |
| 13 |
• | QC1DB |
MEDIAN |
72.1 |
pix |
none | |
50 |
trace_slice_l_xpos |
this |
last_yr |
all
|
position of leftmost slice for CHAN17 |
| 14 |
• | QC1DB |
MEDIAN |
69.6 |
pix |
none | |
50 |
trace_slice_l_xpos |
this |
last_yr |
all
|
position of leftmost slice for CHAN15 |
| 15 |
• | QC1DB |
MEDIAN |
66.7 |
pix |
none | |
50 |
trace_slice_l_xpos |
this |
last_yr |
all
|
position of leftmost slice for CHAN13 |
| 16 |
• | QC1DB |
MEDIAN |
87.5 |
pix |
none | |
50 |
trace_slice_l_xpos |
this |
last_yr |
all
|
position of leftmost slice for CHAN14 |
| 17 |
• | QC1DB |
MEDIAN |
78.7 |
pix |
none | |
50 |
trace_slice_l_xpos |
this |
last_yr |
all
|
position of leftmost slice for CHAN16 |
| 18 |
• | QC1DB |
MEDIAN |
76.4 |
pix |
none | |
50 |
trace_slice_l_xpos |
this |
last_yr |
all
|
position of leftmost slice for CHAN18 |
| 19 |
• | QC1DB |
MEDIAN |
67.7 |
pix |
none | |
50 |
trace_slice_l_xpos |
this |
last_yr |
all
|
position of leftmost slice for CHAN23 |
| 20 |
• | QC1DB |
MEDIAN |
63.8 |
pix |
none | |
50 |
trace_slice_l_xpos |
this |
last_yr |
all
|
position of leftmost slice for CHAN21 |
| 21 |
• | QC1DB |
MEDIAN |
75.3 |
pix |
none | |
50 |
trace_slice_l_xpos |
this |
last_yr |
all
|
position of leftmost slice for CHAN19 |
| 22 |
• | QC1DB |
MEDIAN |
92.3 |
pix |
none | |
50 |
trace_slice_l_xpos |
this |
last_yr |
all
|
position of leftmost slice for CHAN20 |
| 23 |
• | QC1DB |
MEDIAN |
80.9 |
pix |
none | |
50 |
trace_slice_l_xpos |
this |
last_yr |
all
|
position of leftmost slice for CHAN22 |
| 24 |
• | QC1DB |
MEDIAN |
85.6 |
pix |
none | |
50 |
trace_slice_l_xpos |
this |
last_yr |
all
|
position of leftmost slice for CHAN24 |
| |
|
*Data sources: QC1DB: QC1 database; LOCAL: local data source
|
