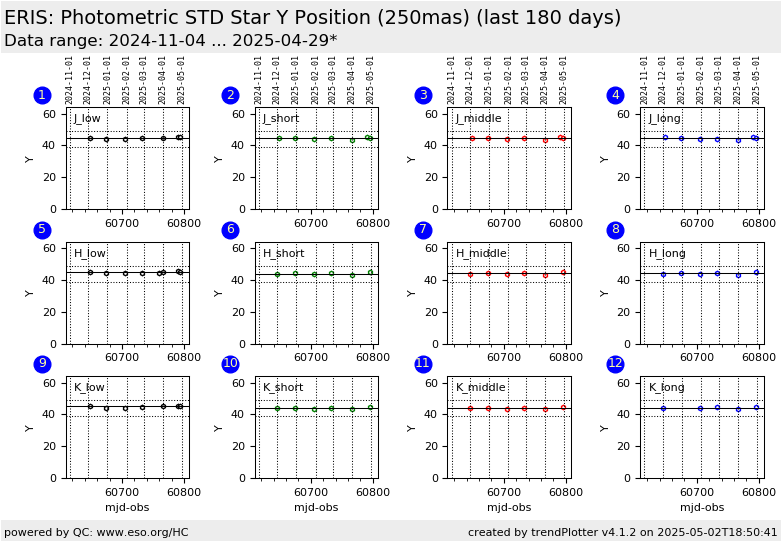
ERIS trending system: HEALTH CHECK report
Last update: 2026-07-27T18:51:28 (UT)
[enable javascript for displaying time difference!]
General news:
NOTE: The Health Check and calChecker services have been moved to qcFlow. These pages are only maintained for comparison
and will be removed in 2026.
ERIS news:
Report news:
Plot? Symb? Source Average ? Thresholds ? N_ QC1 Data Remarks
method value unit method value
1
o QC1DB MEDIAN 43.2 pixels VAL 39,49 3 qc_centery
this |
last_yr |
all
Y position of the reconstructed cube in the J-low 250mas
2
o QC1DB MEDIAN 43.2 pixels VAL 39,49 3 qc_centery
this |
last_yr |
all
Y position of the reconstructed cube in the J-short 250mas
3
o QC1DB MEDIAN 43 pixels VAL 39,49 3 qc_centery
this |
last_yr |
all
Y position of the reconstructed cube in the J-mid 250mas
4
o QC1DB MEDIAN 44 pixels VAL 39,49 2 qc_centery
this |
last_yr |
all
Y position of the reconstructed cube in the J-long 250mas
5
o QC1DB MEDIAN 42.9 pixels VAL 39,49 4 qc_centery
this |
last_yr |
all
Y position of the reconstructed cube in the H-low 250mas
6
o QC1DB MEDIAN 43.1 pixels VAL 39,49 3 qc_centery
this |
last_yr |
all
Y position of the reconstructed cube in the H-short 250mas
7
o QC1DB MEDIAN 43.2 pixels VAL 39,49 3 qc_centery
this |
last_yr |
all
Y position of the reconstructed cube in the H-mid 250mas
8
o QC1DB MEDIAN 43 pixels VAL 39,49 3 qc_centery
this |
last_yr |
all
Y position of the reconstructed cube in the H-long 250mas
9
o QC1DB MEDIAN 42.9 pixels VAL 39,49 4 qc_centery
this |
last_yr |
all
Y position of the reconstructed cube in the K-low 250mas
10
o QC1DB MEDIAN 43.1 pixels VAL 39,49 3 qc_centery
this |
last_yr |
all
Y position of the reconstructed cube in the K-short 250mas
11
o QC1DB MEDIAN 43.2 pixels VAL 39,49 3 qc_centery
this |
last_yr |
all
Y position of the reconstructed cube in the K-mid 250mas
12
o QC1DB MEDIAN 43.2 pixels VAL 39,49 3 qc_centery
this |
last_yr |
all
Y position of the reconstructed cube in the K-long 250mas
*Data sources: QC1DB: QC1 database; LOCAL: local data source
Plot 1 scores: 1 |
data source: eris_ifu_efficiency dataset: qc_centery o median: 43.2 pixels fixed thresholds: 39...49 pixels N_data plotted: 3 [click plot for closeup]
Plot 2 scores: 1 |
data source: eris_ifu_efficiency dataset: qc_centery o median: 43.2 pixels fixed thresholds: 39...49 pixels N_data plotted: 3 [click plot for closeup]
Plot 3 scores: 1 |
data source: eris_ifu_efficiency dataset: qc_centery o median: 43 pixels fixed thresholds: 39...49 pixels N_data plotted: 3 [click plot for closeup]
Plot 4 scores: 1 |
data source: eris_ifu_efficiency dataset: qc_centery o median: 44 pixels fixed thresholds: 39...49 pixels N_data plotted: 2 [click plot for closeup]
Plot 5 scores: 1 |
data source: eris_ifu_efficiency dataset: qc_centery o median: 42.9 pixels fixed thresholds: 39...49 pixels N_data plotted: 4 [click plot for closeup]
Plot 6 scores: 1 |
data source: eris_ifu_efficiency dataset: qc_centery o median: 43.1 pixels fixed thresholds: 39...49 pixels N_data plotted: 3 [click plot for closeup]
Plot 7 scores: 1 |
data source: eris_ifu_efficiency dataset: qc_centery o median: 43.2 pixels fixed thresholds: 39...49 pixels N_data plotted: 3 [click plot for closeup]
Plot 8 scores: 1 |
data source: eris_ifu_efficiency dataset: qc_centery o median: 43 pixels fixed thresholds: 39...49 pixels N_data plotted: 3 [click plot for closeup]
Plot 9 scores: 1 |
data source: eris_ifu_efficiency dataset: qc_centery o median: 42.9 pixels fixed thresholds: 39...49 pixels N_data plotted: 4 [click plot for closeup]
Plot 10 scores: 1 |
data source: eris_ifu_efficiency dataset: qc_centery o median: 43.1 pixels fixed thresholds: 39...49 pixels N_data plotted: 3 [click plot for closeup]
Plot 11 scores: 1 |
data source: eris_ifu_efficiency dataset: qc_centery o median: 43.2 pixels fixed thresholds: 39...49 pixels N_data plotted: 3 [click plot for closeup]
Plot 12 scores: 1 |
data source: eris_ifu_efficiency dataset: qc_centery o median: 43.2 pixels fixed thresholds: 39...49 pixels N_data plotted: 3 [click plot for closeup]
This plot
Position of the Standard stars.
General information
Click on any of the plots to see a close-up version .
The latest date is indicated on top of the plot.
If configured,
data points belonging to the latest date are specially marked statistical averages are indicated by a solid line, and thresholds by broken lines outliers are marked by a red asterisk. They are defined as data points outside the
threshold lines "aliens" (= data points outside the plot Y limits) are marked by a red arrow (↑ ↓ you can download the data for each parameter set if the 'Data downloads' link shows up
