Plot
? |
Symb
? |
Source
* |
Average ? |
Thresholds ? |
N_
data |
QC1
parameter |
Data
downloads |
Remarks |
| method |
value |
unit |
method |
value |
| 1 |
o | QC1DB |
none |
|
pixels |
none | |
0 |
qc_centery |
this |
last_yr |
all
|
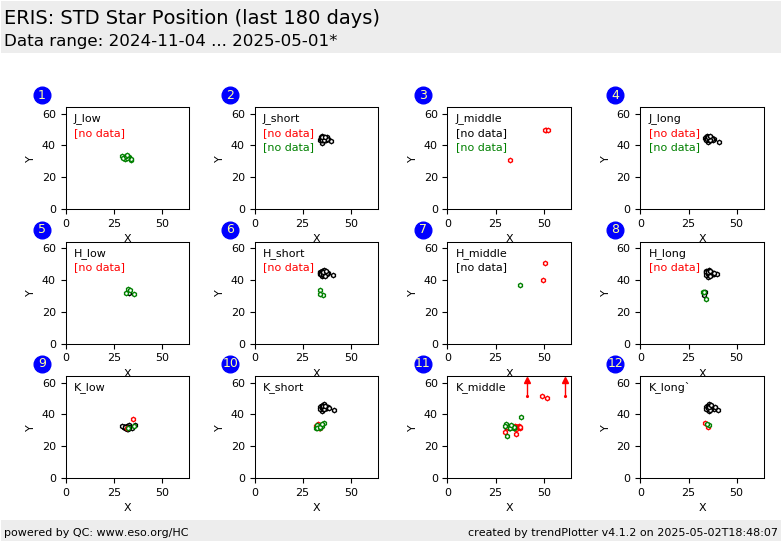
position of the reconstructed cube in the J-low 250mas |
| 1 |
o | QC1DB |
none |
|
pixels |
none | |
0 |
qc_centery |
this |
last_yr |
all
|
position of the reconstructed cube in the J-low 25mas |
| 1 |
o | QC1DB |
none |
|
pixels |
none | |
7 |
qc_centery |
this |
last_yr |
all
|
position of the reconstructed cube in the J-low 100mas |
| 2 |
o | QC1DB |
none |
|
pixels |
none | |
17 |
qc_centery |
this |
last_yr |
all
|
position of the reconstructed cube in the J-short 250mas |
| 2 |
o | QC1DB |
none |
|
pixels |
none | |
0 |
qc_centery |
this |
last_yr |
all
|
position of the reconstructed cube in the J-short 25mas |
| 2 |
o | QC1DB |
none |
|
pixels |
none | |
0 |
qc_centery |
this |
last_yr |
all
|
position of the reconstructed cube in the J-short 100mas |
| 3 |
o | QC1DB |
none |
|
pixels |
none | |
0 |
qc_centery |
this |
last_yr |
all
|
position of the reconstructed cube in the J-mid 250mas |
| 3 |
o | QC1DB |
none |
|
pixels |
none | |
0 |
qc_centery |
this |
last_yr |
all
|
position of the reconstructed cube in the J-mid 25mas |
| 3 |
o | QC1DB |
none |
|
pixels |
none | |
0 |
qc_centery |
this |
last_yr |
all
|
position of the reconstructed cube in the J-mid 100mas |
| 4 |
o | QC1DB |
none |
|
pixels |
none | |
12 |
qc_centery |
this |
last_yr |
all
|
position of the reconstructed cube in the J-long 250mas |
| 4 |
o | QC1DB |
none |
|
pixels |
none | |
0 |
qc_centery |
this |
last_yr |
all
|
position of the reconstructed cube in the J-long 25mas |
| 4 |
o | QC1DB |
none |
|
pixels |
none | |
3 |
qc_centery |
this |
last_yr |
all
|
position of the reconstructed cube in the J-long 100mas |
|
| 5 |
o | QC1DB |
none |
|
pixels |
none | |
1 |
qc_centery |
this |
last_yr |
all
|
position of the reconstructed cube in the H-low 250mas |
| 5 |
o | QC1DB |
none |
|
pixels |
none | |
1 |
qc_centery |
this |
last_yr |
all
|
position of the reconstructed cube in the H-low 25mas |
| 5 |
o | QC1DB |
none |
|
pixels |
none | |
7 |
qc_centery |
this |
last_yr |
all
|
position of the reconstructed cube in the H-low 100mas |
| 6 |
o | QC1DB |
none |
|
pixels |
none | |
16 |
qc_centery |
this |
last_yr |
all
|
position of the reconstructed cube in the H-short 250mas |
| 6 |
o | QC1DB |
none |
|
pixels |
none | |
0 |
qc_centery |
this |
last_yr |
all
|
position of the reconstructed cube in the H-short 25mas |
| 6 |
o | QC1DB |
none |
|
pixels |
none | |
0 |
qc_centery |
this |
last_yr |
all
|
position of the reconstructed cube in the H-short 100mas |
| 7 |
o | QC1DB |
none |
|
pixels |
none | |
2 |
qc_centery |
this |
last_yr |
all
|
position of the reconstructed cube in the H-mid 250mas |
| 7 |
o | QC1DB |
none |
|
pixels |
none | |
0 |
qc_centery |
this |
last_yr |
all
|
position of the reconstructed cube in the H-mid 25mas |
| 7 |
o | QC1DB |
none |
|
pixels |
none | |
0 |
qc_centery |
this |
last_yr |
all
|
position of the reconstructed cube in the H-mid 100mas |
| 8 |
o | QC1DB |
none |
|
pixels |
none | |
16 |
qc_centery |
this |
last_yr |
all
|
position of the reconstructed cube in the H-long 250mas |
| 8 |
o | QC1DB |
none |
|
pixels |
none | |
0 |
qc_centery |
this |
last_yr |
all
|
position of the reconstructed cube in the H-long 25mas |
| 8 |
o | QC1DB |
none |
|
pixels |
none | |
0 |
qc_centery |
this |
last_yr |
all
|
position of the reconstructed cube in the H-long 100mas |
|
| 9 |
o | QC1DB |
none |
|
pixels |
none | |
17 |
qc_centery |
this |
last_yr |
all
|
position of the reconstructed cube in the K-low 250mas |
| 9 |
o | QC1DB |
none |
|
pixels |
none | |
1 |
qc_centery |
this |
last_yr |
all
|
position of the reconstructed cube in the K-low 25mas |
| 9 |
o | QC1DB |
none |
|
pixels |
none | |
5 |
qc_centery |
this |
last_yr |
all
|
position of the reconstructed cube in the K-low 100mas |
| 10 |
o | QC1DB |
none |
|
pixels |
none | |
17 |
qc_centery |
this |
last_yr |
all
|
position of the reconstructed cube in the K-short 250mas |
| 10 |
o | QC1DB |
none |
|
pixels |
none | |
0 |
qc_centery |
this |
last_yr |
all
|
position of the reconstructed cube in the K-short 25mas |
| 10 |
o | QC1DB |
none |
|
pixels |
none | |
0 |
qc_centery |
this |
last_yr |
all
|
position of the reconstructed cube in the K-short 100mas |
| 11 |
o | QC1DB |
none |
|
pixels |
none | |
0 |
qc_centery |
this |
last_yr |
all
|
position of the reconstructed cube in the K-mid 250mas |
| 11 |
o | QC1DB |
none |
|
pixels |
none | |
3 |
qc_centery |
this |
last_yr |
all
|
position of the reconstructed cube in the K-mid 25mas |
| 11 |
o | QC1DB |
none |
|
pixels |
none | |
6 |
qc_centery |
this |
last_yr |
all
|
position of the reconstructed cube in the K-mid 100mas |
| 12 |
o | QC1DB |
none |
|
pixels |
none | |
17 |
qc_centery |
this |
last_yr |
all
|
position of the reconstructed cube in the K-long 250mas |
| 12 |
o | QC1DB |
none |
|
pixels |
none | |
0 |
qc_centery |
this |
last_yr |
all
|
position of the reconstructed cube in the J-long 25mas |
| 12 |
o | QC1DB |
none |
|
pixels |
none | |
0 |
qc_centery |
this |
last_yr |
all
|
position of the reconstructed cube in the K-long 100mas |
|
| |
|
*Data sources: QC1DB: QC1 database; LOCAL: local data source
|
