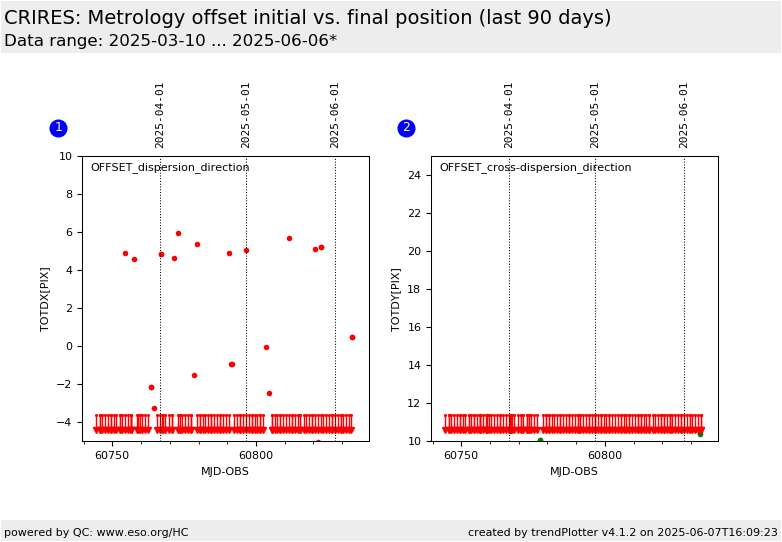
Trending plot for the total offsets between initial and final position
for the CRIRES+ metrology. The offsets in the dispersion direction
(left) and cross-dispersion direction (right) in pixels, recorded in
the FLAT calibrations taken with INS.WLEN.ID=J1228 is monitored.
General information
Click on any of the plots to see a close-up version.
The latest date is indicated on top of the plot.
If configured,
data points belonging to the latest date are specially marked
statistical averages are indicated by a solid line, and thresholds by broken lines
outliers are marked by a red asterisk. They are defined as data points outside the
threshold lines
"aliens" (= data points outside the plot Y limits) are marked by a red arrow (↑ or ↓)
you can download the data for each parameter set if the 'Data downloads' link shows up
