VIMOS pipeline:
CALIB recipes
| HOME | INDEX | SEARCH | HELP | NEWS |
|
VIMOS pipeline: |
|||||
|
|
Bias frames (vmbias)
Purpose. Bias frames are measured to monitor the status of the CCDs. In general they come in stacks of 5 raw frames per quadrant. Bias frames that are used to calibrate imaging data have different read-out windows (2148x2440 vs. 2148x4096) and gain compared to bias measurments for spectroscopy (MOS, IFU). Like all raw files, they have 50 pixels of prescan and 50 of overscan at the left and right sides. Bias files are routinely measured every night when VIMOS is operational. They are processed into master bias frames and quality-checked by QC Garching. Master bias files, like all the processed frames, have overscan and prescan removed. Recipe. The pipeline recipe vmbias is used for each quadrant to produce a median stack of the input raw frames with overscans removed. QC checks. As part of the QC1 checks each master bias is compared with a reference master bias. The following parameters are monitored: bias median level, read-out-noise, rms of master. These values are accessible via the trending page. Products.
Dark frames (crires_spec_dark)
Purpose. Dark frames are measured to monitor the the dark current. In general they come in stacks of 3 raw frames per quadrant. They are taken in two different read-out modes (with 2148x2440 or 2148x4096 pixels). They are typically measured every second month. They are processed into master dark frames and quality-checked by QC Garching. Recipe. The pipeline recipe vmdark is used for each quadrant to produce a median stack of the input bias-subtracted raw frames with overscans removed. QC checks. The QC parameter monitored is the dark current. The dark current values are accessible via trending page. Products.
** index of the PIPEFILE name, coded as PIPEFILE in the fits header *** used in the delivered name IMG screen flat-field frames (vmimflatscreen) DPR.CATG = CALIB; DPR.TYPE = FLAT,LAMP; DPR.TECH = IMAGE
Purpose. Screen flat-fields are not used to calibrate science data. They are measured in order to monitor the detector gain and to monitor the performance of continuum lamps and filters. They come as stacks of five raw frames per filter and quadrant. Recipe. The pipeline recipe vmflatscreen combines the stack of raw frames into a master flat and calculates detector gain, lamp flux, and noise parameters. QC checks. QC1 parameters for gain, lamp efficiency and noise are monitored on the trending pages. Products.
** index of the PIPEFILE name, coded as PIPEFILE in the fits header *** used in the delivered name IMG twilight (sky) flat-field frames (vmimflatsky) DPR.CATG = CALIB; DPR.TYPE = FLAT,SKY; DPR.TECH = IMAGE
Purpose. Sky flat fields are used to produce pixel-to-pixel efficiency maps for reducing science images. They are measured during evening or morning twilight and come as stacks of at least three raw frames per quadrant (depending on the sky flux level). Sky flats are routinely measured every night during when VIMOS is operational in imaging mode. They are processed into master sky flats and quality-checked by QC Garching. Recipe. The pipeline recipe vmimflatsky produces a normalized master screen flat. The raw frames are bias subtracted and combined, the result is normalized by its mean value. QC checke. Twilight flats of each quadrant are visually checked for star removal, vignetting and structure and compared with a reference master. A structure paramter is monitored via the trending page. Products.
** index of the PIPEFILE name, coded as PIPEFILE in the fits header *** used in the delivered name IMG photometric standard stars (vmimstandard) DPR.CATG = CALIB; DPR.TYPE = STD; DPR.TECH = IMAGE
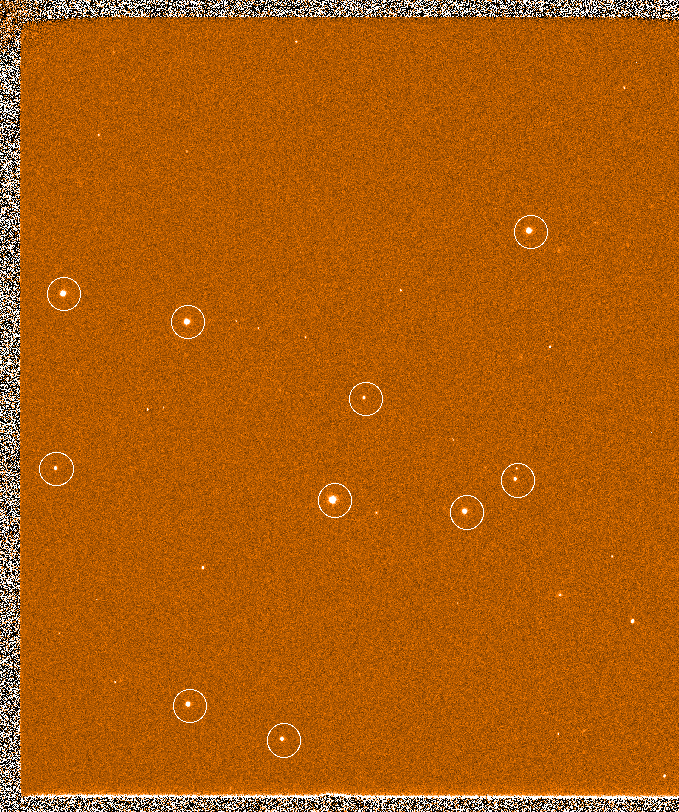
Purpose. Photometric standard stars are observed in filters U, B,V, R, and I. They are used to compute photometric zeropoints. This parameter provides information on the total throughput of the telescope and the instrument. Zeropoints are calculated per quadrant and filter on a frame-by-frame basis and as averages of all observations during a night. Recipe. vmimstandard does bias-subtraction, removes overscans, and flat-fields each single photometric standard star field, then runs SExtractor (Bertin & Arnouts 1996, A&A 117, 393) to find all objects in the field and to compute their instrumental magnitude (i.e. the SExtractor MAG_BEST). Photometric standard stars are identified using an input catalog, and written in a table together with their instrumental and catalog magnitudes. The recipe also outputs the reduced standard star frame. QC checks. Visual checks on the reduced frames are performed. Averaged zeropoints for the night are monitored (see below). Products.
** index of the PIPEFILE name, coded as PIPEFILE in the fits header *** used in the delivered name Night zeropoints (vmimcalphot) PRO.CATG = IMG_STAR_MATCH_TABLE Recipe. The pipeline recipe vmimcalphot uses the output of vmimstandard (i.e. the IMG_STAR_MATCH_TABLE files) and computes the airmass and color-corrected magnitude zeropoints of the night. The input is the set of all available tables per filter and per quadrant produced by vmimstandard. The output is a zeropoint table containing the magnitude zeropoint value (in ADU), the color term, the color index and the extinction coefficient. This zeropoint is then used in ADU to calibrate science images and it is converted into electrons for trending. QC checks. Night zeropoints in electrons corrected by extinction and color are monitored for each quadrant and each filter by QC Garching (see trending page). Products.
** index of the PIPEFILE name, coded as PIPEFILE in the fits header *** used in the delivered name MOS flat-field and wavelength calibration frames (vmmoscalib) DPR.CATG = CALIB; DPR.TYPE = FLAT, LAMP; DPR.TECH = MOS
Purpose. MOS flat-field and arc-lamp exposures are measured either in the morning following the science observations or as attached calibrations immediately after the corresponding science observation. As of February 2010, attached night-time MOS calibrations are mandatory. Spectroscopic flats contain the slit function and fixed pattern noise. Arc-lamp exposures give the inverse dispersion solution needed for wavelength calibration. Recipe vmmoscalib. The vmmoscalib recipe combines the functionalities of vmspflat and vmspcaldisp (see below). It uses a pattern-matching approach for wavelength calibration. It is used for data reduction since August 2010. The recipe needs as input one arc-lamp frame and at least one flat field. It is assumed that both calibration types have been measured almost simultaneously so that they represent the status of the instrument at the same time. A pattern-matching algorithm is used to identify reference lines in the arc-lamp frame which are then used to determine the wavelength calibration. The flat-field exposures are used to define extraction masks that are applied to the science data. Stacked and normalised master flats are also created. It is crucial for pattern matching to identify the arc lines and to distiguish them from random noise. The initial line identification can be controlled with the pipeline parameter peakdetection which gives the level above the background that a line must have in order to be considered. The parameter values that are used by the automated reduction are reasonable but in case of highly multiplexed observations fine-tuning may be useful so that the first order spectrum is better distinguished from contaminating -1 order spectra. MOS masks can be constructed so that they contain multiple layers of slits along the dispersion direction (so called multiplexing). This feature can be used for LR and MR grisms. The recipe vmmoscalib detects the number of multiplex layers present in the input and creates output files which are multi-extension fits files (MEFs). The number of extensions is equal to the number of multiplex layers (up to 4 for LR grisms and 2 for MR). If multiplexing is not used then fits files without extensions are created. This strategy is necessary because spectra from two multiplex layers can overlap; MEFs allow to clearly distinguish them QC checks. The inverse dispersion solution and curvature model found are applied to the arc-lamp frame to produce an image containing the 2-dimensional extracted spectra of all slits. At this point the residuals are computed for all arc lines listed in the catalog in the grism spectral range. These residuals are the difference between the expected line catalog position in the arc-lamp 2D extracted spectra and the position of the closest line to the expected position found. The RMS of these residuals (in pixels) is an indicator of the precision of the inverse dispersion solution for all slits and the entire wavelength range, and is listed in the product header under the keyword HIERARCH ESO QC MOS IDS RMS. It is monitored on the trending page, together with the resolution at three different wavelengths. A random number of extracted arc-lamp frames and master flats is also checked visually for unsusual artifacts. Products.
* coded as HIERARCH.ESO.PRO.CATG in the fits header The table MOS_SLIT_LOCATION contains slit positions on the CCD and in the MOS_ARC_SPECTRUM_EXTRACTED frame. Slits are listed from left to right according to the x position on the CCD. The slit identification number is read from the fits header of the input. The table has the following columns:
The table MOS_DISP_COEFF contains the polynomial coefficients of the wavelength calibration. The rows correspond to the rows in the MOS_ARC_SPECTRUM_EXTRACTED frame:
The table MOS_CURV_COEFF contains the polynomial coefficients of the spatial curvature fitting:
MOS flat-field frames (vmspflat) DPR.CATG = CALIB; DPR.TYPE = FLAT, LAMP; DPR.TECH = MOS
Purpose. MOS flats are measured either in the morning following the science observations or as attached calibrations immediately after the corresponding science observation. As of February 2010, attached night-time MOS calibrations are mandatory. Spectroscopic flats in principle contain the slit function and fixed pattern noise. The red flats of the old detectors (before June 2010) show also fringes, that are different from the science exposure. For this reason, flat-fielding can introduce artificial features in science frames. Therefore, science data in the red grisms are not flat-fielded. The flat fields are instead used to refine the spectral curvature model. Recipe vmspflat. The vmspflat recipe expects a stack of frames that can also be obtained with different mask shutter positions to avoid spectra contamination. The product is a normalized master flat. This recipe has been used until May 2010. It is still available in the pipeline distribution. QC checks. A random number of master flats is checked visually for unsusual artifacts. Products.
** index of the PIPEFILE name, coded as PIPEFILE in the fits header *** used in the delivered name MOS arc lamp frames (vmspcaldisp) DPR.CATG = CALIB; DPR.TYPE = WAVE,LAMP; DPR.TECH=MOS
Purpose. MOS arc-lamp exposures are measured either in the morning following the science observations or as attached calibrations immediately after the corresponding science observation. As of February 2010, attached night-time MOS calibrations are mandatory. They give the inverse dispersion solution needed for wavelength calibration. Recipe vmspcaldisp. The vmspcaldisp recipe expects one arc-lamp exposure containing in the header a first guess inverse dispersion solution (ESO PRO IDS MAT_i_j_k keywords), a spectral curvature model (ESO PRO CRV MOD_i_j_k) and optical distortions models (ESO PRO OPT DIS X/Y_i_j). A master flat field can also be given in case the refined curvature and distorsion models are to be computed. The inverse dispersion solution and the spectral curvature are computed for each line of each slit and written in a table. The RMS of the inverse dispersion solution residuals is also evaluated. This recipe has been used until May 2010. It is still available in the pipeline distribution. QC checks. The inverse dispersion solution and curvature model found are applied to the arc-lamp frame to produce an image containing the 2-dimensional extracted spectra of all slits. At this point the residuals are computed for all arc lines listed in the catalog in the grism spectral range. These residuals are the difference between the expected line catalog position in the arc-lamp 2D extracted spectra, and the position of the closest line to the expected position found. The RMS of these residuals (in pixels) is the indicator of the precision of the inverse dispersion solution for all slits and the entire wavelength range, and is listed in the product header under the keyword HIERARCH ESO QC MOS IDS RMS. It is monitored on the trending page, together with the resolution at three different wavelengths. Products.
** index of the PIPEFILE name, coded as PIPEFILE in the fits header *** used in the delivered name The inverse dispersion solution table contains the following columns used for MOS science spectra calibration and for spectra extraction:
Y is the dispersion direction coordinate. The image position X0,Y0 of the center of the slit x,y on the mask, for a given wavelength lambda0 assumed as the reference wavelength and written in the grism table, is derived using the optical distorsion model written in the header coefficients "ESO PRO OPT DIS X_i_j" = Oij, "ESO PRO OPT DIS Y_i_j" = Qij X0=O00+O10xm+O01ym+O20xm2+...... and Y0=Q00+Q10xm+Q01ym+Q20xm2+......Then the spectral curvature model (i.e. the curvature on the CCD of spectrum corresponding to the point x,y of the mask) is refined for each row using the slit borders of the flat-field and starting from the first guess to find the coefficients CRV_POLi = Ci: X-Xs=C1(Y-Y0)+C2(Y-Y0)2+... Similarly the inverse dispersion relation is given by the coefficients INV_DISi=Di:Y-Y0=D0+D1(lambda-lambda0)+D2(lambda-lambda0)2+... By construction we have: lambda(Y0)=lambda0 and lambda(X0)=lambda0 .MOS standard star frames (vmmosstandard) DPR.CATG = CALIB; DPR.TYPE = STD; DPR.TECH=MOS
Purpose. Spectrophotometric standards are acquired with an 8-slits mask. Four exposures are taken; the telescope is shifted in betwee in order to have the same standard in each of the four quadrants. Recipe vmmosscience. The pipeline recipe vmmosscience is available since pipeline version 2.3.9 and is used also for the reduction of MOS spectrophotometric standard stars. It expects as input calibration products the output of the recipe vmmoscalib. It is used for data reduction since August 2010. The recipe vmmosscience uses the same algorithm for standard star exposures and for science observations (see there). It creates in addition to the products that are also created for science data a SPECPHOT_TABLE that contains efficiency and response curves. Details about flux calibration can be found here. QC checks. Spectra are checked visually for proper extraction. Instrument efficiency is monitored via the Health Check pages. Products.
* coded as HIERARCH.ESO.PRO.CATG in the fits header Recipe vmmosstandard. The recipe vmmosstandard applies bias subtraction and overscan removel. The spectrum of the standard star is extracted in the same way as for science data (see vmmosobsstare). Details about flux calibration can be found here. This recipe has been used until May 2010. It is still available in the pipeline distribution. QC checks. Spectra are checked visually for proper extraction. Instrument efficiency is monitored via the Health Check pages. Products.
** index of the PIPEFILE name, coded as PIPEFILE in the fits header *** used in the delivered name IFU flat-field and arc lamp frames (vmifucalib) DPR.CATG = CALIB; DPR.TYPE = FLAT,LAMP; DPR.TECH=IFU
Purpose. IFU arc-lamp and flat-field frames are taken during night-time immediately after the science observation with the same instrument rotation angle as the science. This approach is required because of instrument instabilities. Flat-fields are used for identifying and tracing fibres and for computing their relative transmission, arc-lamps are used for wavelength calibration. Recipe. The vmifucalib recipe expects one arc-lamp and at least one flat-field exposure. The recipe uses also a fibre identification file containing information on the fibre positions. Spectral distortion is computed by tracing the flat-field spectra. Wavelength calibration is done after extracting the arc-lamp spectra along the flat-field traces. The RMS of the inverse dispersion solution residuals is also evaluated and written in the header keyword HIERARC ESO QC IFU IDS RMS. QC checks. SExtracted and wavelength-calibrated arc-lamp spectra are checked visually for consistent wavelength calibration. Several QC1 parameters are monitored on the Health Check pages. These include spectral resolution, the number of calibrated fibres, the number of the central identified fibre, the RMS of the inverse dispersion solution, and the slope of the fibre traces. Products.
** index of the PIPEFILE name, coded as PIPEFILE in the fits header *** used in the delivered name The inverse dispersion solution file (product category IFU_IDS) contains one table extension for each active pseudo-slit. Each table contains the coefficients of the polynomial fits for each of the 400 fibres, starting from the first fibre to the left.
The extraction file (product category IFU_TRACE) contains two table extensions for each active pseudo slit. Each table contains the coefficients of the polynomial fits for each of the 400 fibres, starting from the first fibre to the left. The first table extension coefficients refer to the whole spectral range, the second extension coefficients are obtained by linear fitting of the traces on a shorter spectral range.
The transmission file (product category IFU_TRANSMISSION) contains the fibre to fibre relative transmission correction factors for each of the 400 (high or medium resolution) or 1600 fibres (low resolution), starting from the first fibre spectrum of the first pseudo-slit.
IFU standard star frames (vmifustandard) DPR.CATG = CALIB; DPR.TYPE = STD; DPR.TECH=IFU
Purpose. Spectrophotometric standards are measured near in time to IFU science observations. Four exposures are taken; the telescope is shifted in betwee in order to have the same standard in each of the four quadrants. Recipe. The recipe vmifustandard requires in addition to the raw standard star frame, three files produced with the vmifucalib recipe (product categories IFU_IDS, IFU_TRACE, IFU_TRANSMISSION). Spectra are extracted and resampled to a constant wavelength step (as stored in the header keyword CDELT1). The extracted spectra are transmission corrected and background-subtracted. They are stored in the output image in the usual order: successively from pseudo-slit1 to pseudo-slit4 counting fibers from left to right. Blue wavelengths are on the left. Details about flux calibration can be found here. QC checks. Spectra are checked visually for proper extraction. Instrument efficiency is monitored via the Health Check pages. Products.
** index of the PIPEFILE name, coded as PIPEFILE in the fits header *** used in the delivered name |
||||||||||||||||||||||||||||||||||||||||||||||||||||||||||||||||||||||||||||||||||||||||||||||||||||||||||||||||||||||||||||||||||||||||||||||||||||||||||||||||||||||||||||||||||||||||||||||||||||||||||||||||||||||||||||||||||||||||||||||||||||||||||||||||||||||||||||||||||||||||||||||||||||||||||||||||||||||||||||||||||||||||||||||||||||||||||||||||||||||||||||||||||||||||||||||||||||||||||||||||||||||||||||||||||||||||||||||||||||||||||||||||||||||||||||||||||||||||||||||||||||||||||||||||||||||||||||||||||||||||||||||||||||||||||||
|
|
|||||||||||||||||||||||||||||||||||||||||||||||||||||||||||||||||||||||||||||||||||||||||||||||||||||||||||||||||||||||||||||||||||||||||||||||||||||||||||||||||||||||||||||||||||||||||||||||||||||||||||||||||||||||||||||||||||||||||||||||||||||||||||||||||||||||||||||||||||||||||||||||||||||||||||||||||||||||||||||||||||||||||||||||||||||||||||||||||||||||||||||||||||||||||||||||||||||||||||||||||||||||||||||||||||||||||||||||||||||||||||||||||||||||||||||||||||||||||||||||||||||||||||||||||||||||||||||||||||||||||||||||||||||||||||||
 |
|
||||||||||||||||||||||||||||||||||||||||||||||||||||||||||||||||||||||||||||||||||||||||||||||||||||||||||||||||||||||||||||||||||||||||||||||||||||||||||||||||||||||||||||||||||||||||||||||||||||||||||||||||||||||||||||||||||||||||||||||||||||||||||||||||||||||||||||||||||||||||||||||||||||||||||||||||||||||||||||||||||||||||||||||||||||||||||||||||||||||||||||||||||||||||||||||||||||||||||||||||||||||||||||||||||||||||||||||||||||||||||||||||||||||||||||||||||||||||||||||||||||||||||||||||||||||||||||||||||||||||||||||||||||||||||||
![[dark.gif 11K]](../img/bias.gif)
![[dark.gif 11K]](../img/dark.gif)
![[scrflat.gif 14K]](../img/scrflat.gif)
![[skyflat.gif 14K]](../img/skyflat.gif)
![[std.gif 10K]](../img/mosflatraw.gif)
![[std.gif 10K]](../img/mosarc.gif)
![[std.gif 10K]](../img/mosflatred.gif)
![[mosstd.gif 10K]](../img/mosstd.gif)
![[std.gif 10K]](../img/ifuflatLRredraw.gif)
![[std.gif 10K]](../img/ifuflatLRredred.gif)
![[ifuflatHRredraw.gif 10K]](../img/ifuflatHRredraw.gif)
![[ifuflatHRredred.gif 10K]](../img/ifuflatHRredred.gif)
![[std.gif 10K]](../img/ifuwaveLRredraw.gif)
![[std.gif 10K]](../img/ifuwaveHRredraw.gif)
![[ifustd.gif 10K]](../img/ifustd.gif)
![[ifustd.gif 10K]](../img/ifustdred.gif)