mirror sites: PL (internal link) HQ     [?]

Health Check monitor


CAL | HC | QC
HealthCheck Monitor
   HOME | UsersGuide
  sl icon ALL INSTRUMENTS
 
all KPI reports
PIONIER:
Wavelength
Other HC:
QC links:
        [page auto-refreshes after 300 sec]   [stop | on]            [press Ctrl+Shift+R to enforce refresh of scores, dates and news]
PIONIER trending system: HEALTH CHECK report
HELP USERS-GUIDE MORE
Last update: 2025-11-18T12:35:27 (UT)
  | now: 2026-04-17T06:08:29 (UT) muc05 QC pipeline: pioni-3.9.6 (installed 2023-06-22)
same group: Wavelength_High_Sens Wavelength_Medium_Sens
General news: NOTE: The Health Check and calChecker services have been moved to qcFlow. These pages are only maintained for comparison and will be removed in 2026.
PIONIER news: 2023-02-06 Internal efficiency, median darks are outside KPI which is related to a pump not working. As operations continue, the thresholds have been adapted to show calibratibility and keep track of sudden anomalies.
Report news:
DATE*: [?] 2026-04-10
no data | NLT
2026-04-11
no data | NLT
2026-04-12
no data | NLT
2026-04-13
no data | NLT
2026-04-14
no data | NLT
2026-04-15
no data | NLT
2026-04-16
no data | NLT
r...
Raw CAL displays:
n/a n/a n/a n/a n/a n/a no CAL raw files
P...
CAL product quality:
products products products products products products no CAL products
 
transfer   ngas [?]

scores&comments | FULL | history ... | plot tutorial ... | contact | HC_docu... | quality events...                 daily/often; important to check     [?]
*Date on this monitor changes at 21:00 UT
png: Information and research:
- png file - advanced studies: QC1 browser | QC1 plotter
Plot
?
Symb
?
Source
*
Average ? Thresholds ? N_
data
QC1
parameter
Data
downloads
Remarks
method value unit method value
1 QC1DB none   microns none  90 spec_cal_effwave this | last_yr | all lambda_central GRISM High sensitivity
2 QC1DB none   10-8 none  0 spec_cal_effband this | last_yr | all Medium sensitivity
3 QC1DB none   10-8 none  0 spec_cal_effwave_ptp this | last_yr | all Medium sensitivity
4 QC1DB none   microns none  90 spec_cal_effwave this | last_yr | all Medium sensitivity
5 QC1DB none   10-8 none  90 spec_cal_effband this | last_yr | all Medium sensitivity
6 QC1DB none   10-8 none  90 spec_cal_effwave_ptp this | last_yr | all Medium sensitivity
*Data sources: QC1DB: QC1 database; LOCAL: local data source
Plot 1
scores: not implemented
data source:pionier_spectral_calib
(QC1 database)
dataset:spec_cal_effwave
average:none
thresholds:none
N_data plotted:90
[click plot for closeup]
Plot 2
scores: not implemented
data source:pionier_spectral_calib
(QC1 database)
dataset:spec_cal_effband
average:none
thresholds:none
N_data plotted:0
[click plot for closeup]
Plot 3
scores: not implemented
data source:pionier_spectral_calib
(QC1 database)
dataset:spec_cal_effwave_ptp
average:none
thresholds:none
N_data plotted:0
[click plot for closeup]
Plot 4
scores: not implemented
data source:pionier_spectral_calib
(QC1 database)
dataset:spec_cal_effwave
average:none
thresholds:none
N_data plotted:90
[click plot for closeup]
Plot 5
scores: not implemented
data source:pionier_spectral_calib
(QC1 database)
dataset:spec_cal_effband
average:none
thresholds:none
N_data plotted:90
[click plot for closeup]
Plot 6
scores: not implemented
data source:pionier_spectral_calib
(QC1 database)
dataset:spec_cal_effwave_ptp
average:none
thresholds:none
N_data plotted:90
[click plot for closeup]
This plot

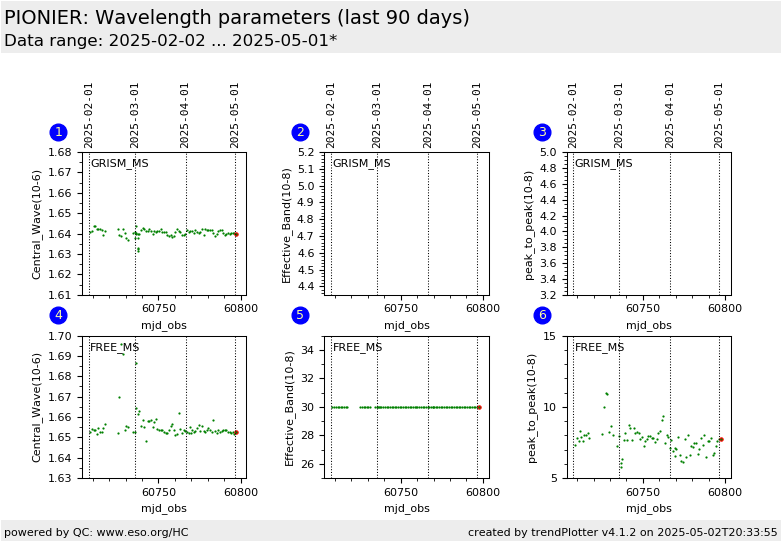
The pipeline calculates the central wavelength as well as the average value of the effective bandwidth for the 2 dispersive modes : GRISM and FREE.
Plots 3 and 6 (peak_to_peak) monitor the maximum variation of the effective band between the different baselines


The detector polarization voltages (DET.POLAR) are :
High Sensitivity : 7100 mV
Medium_ Sensitivity: 5000 mV
Low_Sensitivity : 1000 mV  


General information

Click on any of the plots to see a close-up version.

The latest date is indicated on top of the plot.

If configured,

  • data points belonging to the latest date are specially marked
  • statistical averages are indicated by a solid line, and thresholds by broken lines
  • outliers are marked by a red asterisk. They are defined as data points outside the threshold lines
  • "aliens" (= data points outside the plot Y limits) are marked by a red arrow ( or )
  • you can download the data for each parameter set if the 'Data downloads' link shows up