Plot
? |
Symb
? |
Source
* |
Average ? |
Thresholds ? |
N_
data |
QC1
parameter |
Data
downloads |
Remarks |
| method |
value |
unit |
method |
value |
| 1 |
• | QC1DB |
none |
|
microns |
none | |
205 |
max_opd1 |
this |
last_yr |
all
|
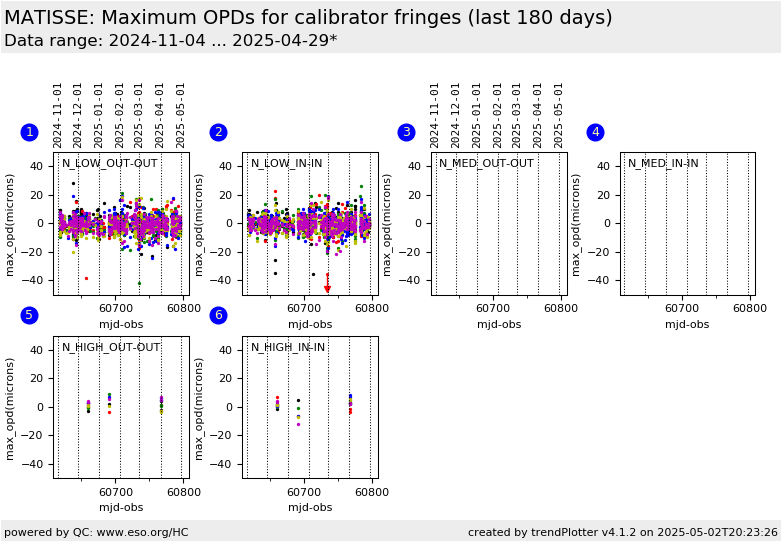
Maximum OPD bas1 N OUT-OUT |
| 1 |
• | QC1DB |
none |
|
microns |
none | |
205 |
max_opd2 |
this |
last_yr |
all
|
Maximum OPD bas2 N OUT-OUT |
| 1 |
• | QC1DB |
none |
|
microns |
none | |
205 |
max_opd3 |
this |
last_yr |
all
|
Maximum OPD bas3 N OUT-OUT |
| 1 |
• | QC1DB |
none |
|
microns |
none | |
205 |
max_opd4 |
this |
last_yr |
all
|
Maximum OPD bas4 N OUT-OUT |
| 1 |
• | QC1DB |
none |
|
microns |
none | |
205 |
max_opd5 |
this |
last_yr |
all
|
Maximum OPD bas5 N OUT-OUT |
| 1 |
• | QC1DB |
none |
|
microns |
none | |
205 |
max_opd6 |
this |
last_yr |
all
|
Maximum OPD bas6 N OUT-OUT |
| 2 |
• | QC1DB |
none |
|
microns |
none | |
205 |
max_opd1 |
this |
last_yr |
all
|
Maximum OPD bas1 N IN-IN |
| 2 |
• | QC1DB |
none |
|
microns |
none | |
205 |
max_opd2 |
this |
last_yr |
all
|
Maximum OPD bas2 N IN-IN |
| 2 |
• | QC1DB |
none |
|
microns |
none | |
205 |
max_opd3 |
this |
last_yr |
all
|
Maximum OPD bas3 N IN-IN |
| 2 |
• | QC1DB |
none |
|
microns |
none | |
205 |
max_opd4 |
this |
last_yr |
all
|
Maximum OPD bas4 N IN-IN |
| 2 |
• | QC1DB |
none |
|
microns |
none | |
205 |
max_opd5 |
this |
last_yr |
all
|
Maximum OPD bas5 N IN-IN |
| 2 |
• | QC1DB |
none |
|
microns |
none | |
205 |
max_opd6 |
this |
last_yr |
all
|
Maximum OPD bas6 N IN-IN |
| 3 |
• | QC1DB |
none |
|
microns |
none | |
0 |
max_opd1 |
this |
last_yr |
all
|
Maximum OPD bas1 N OUT-OUT |
| 3 |
• | QC1DB |
none |
|
microns |
none | |
0 |
max_opd2 |
this |
last_yr |
all
|
Maximum OPD bas2 N OUT-OUT |
| 3 |
• | QC1DB |
none |
|
microns |
none | |
0 |
max_opd3 |
this |
last_yr |
all
|
Maximum OPD bas3 N OUT-OUT |
| 3 |
• | QC1DB |
none |
|
microns |
none | |
0 |
max_opd4 |
this |
last_yr |
all
|
Maximum OPD bas4 N OUT-OUT |
| 3 |
• | QC1DB |
none |
|
microns |
none | |
0 |
max_opd5 |
this |
last_yr |
all
|
Maximum OPD bas5 N OUT-OUT |
| 3 |
• | QC1DB |
none |
|
microns |
none | |
0 |
max_opd6 |
this |
last_yr |
all
|
Maximum OPD bas6 N OUT-OUT |
| 4 |
• | QC1DB |
none |
|
microns |
none | |
0 |
max_opd1 |
this |
last_yr |
all
|
Maximum OPD bas1 N IN-IN |
| 4 |
• | QC1DB |
none |
|
microns |
none | |
0 |
max_opd2 |
this |
last_yr |
all
|
Maximum OPD bas2 N IN-IN |
| 4 |
• | QC1DB |
none |
|
microns |
none | |
0 |
max_opd3 |
this |
last_yr |
all
|
Maximum OPD bas3 N IN-IN |
| 4 |
• | QC1DB |
none |
|
microns |
none | |
0 |
max_opd4 |
this |
last_yr |
all
|
Maximum OPD bas4 N IN-IN |
| 4 |
• | QC1DB |
none |
|
microns |
none | |
0 |
max_opd5 |
this |
last_yr |
all
|
Maximum OPD bas5 N IN-IN |
| 4 |
• | QC1DB |
none |
|
microns |
none | |
0 |
max_opd6 |
this |
last_yr |
all
|
Maximum OPD bas6 N IN-IN |
| 5 |
• | QC1DB |
none |
|
microns |
none | |
40 |
max_opd1 |
this |
last_yr |
all
|
Maximum OPD bas1 N OUT-OUT |
| 5 |
• | QC1DB |
none |
|
microns |
none | |
40 |
max_opd2 |
this |
last_yr |
all
|
Maximum OPD bas2 N OUT-OUT |
| 5 |
• | QC1DB |
none |
|
microns |
none | |
40 |
max_opd3 |
this |
last_yr |
all
|
Maximum OPD bas3 N OUT-OUT |
| 5 |
• | QC1DB |
none |
|
microns |
none | |
40 |
max_opd4 |
this |
last_yr |
all
|
Maximum OPD bas4 N OUT-OUT |
| 5 |
• | QC1DB |
none |
|
microns |
none | |
40 |
max_opd5 |
this |
last_yr |
all
|
Maximum OPD bas5 N OUT-OUT |
| 5 |
• | QC1DB |
none |
|
microns |
none | |
40 |
max_opd6 |
this |
last_yr |
all
|
Maximum OPD bas6 N OUT-OUT |
| 6 |
• | QC1DB |
none |
|
microns |
none | |
40 |
max_opd1 |
this |
last_yr |
all
|
Maximum OPD bas1 N IN-IN |
| 6 |
• | QC1DB |
none |
|
microns |
none | |
40 |
max_opd2 |
this |
last_yr |
all
|
Maximum OPD bas2 N IN-IN |
| 6 |
• | QC1DB |
none |
|
microns |
none | |
40 |
max_opd3 |
this |
last_yr |
all
|
Maximum OPD bas3 N IN-IN |
| 6 |
• | QC1DB |
none |
|
microns |
none | |
40 |
max_opd4 |
this |
last_yr |
all
|
Maximum OPD bas4 N IN-IN |
| 6 |
• | QC1DB |
none |
|
microns |
none | |
40 |
max_opd5 |
this |
last_yr |
all
|
Maximum OPD bas5 N IN-IN |
| 6 |
• | QC1DB |
none |
|
microns |
none | |
40 |
max_opd6 |
this |
last_yr |
all
|
Maximum OPD bas6 N IN-IN |
| |
|
*Data sources: QC1DB: QC1 database; LOCAL: local data source
|
