mirror sites: PL (internal link) HQ     [?]

Health Check monitor


CAL | HC | QC
HealthCheck Monitor
   HOME | UsersGuide
  sl icon ALL INSTRUMENTS
 
all KPI reports
KMOS:
sky flat
Other HC:
QC links:
        [page auto-refreshes after 300 sec]   [stop | on]            [press Ctrl+Shift+R to enforce refresh of scores, dates and news]
KMOS trending system: HEALTH CHECK report
HELP USERS-GUIDE MORE
Last update: 2025-06-01T15:31:51 (UT)
  | now: 2026-04-17T11:01:58 (UT) muc01 QC pipeline: kmos-4.0.3 (installed 2022-03-28)
same group: non-uniformity uniformity maxdev
General news: NOTE: The Health Check and calChecker services have been moved to qcFlow. These pages are only maintained for comparison and will be removed in 2026.
KMOS news:  
Report news:
DATE*: [?] 2025-05-26
report | NLT
2025-05-27
report | NLT
2025-05-28
report | NLT
2025-05-29
report | NLT
2025-05-30
report | NLT
2025-05-31
report | NLT
2025-06-01
report | NLT
r...
Raw CAL displays:
raw raw raw raw raw raw raw
P...
CAL product quality:
products products products products products products products
 
transfer     [?]

scores&comments | history ... | plot tutorial ... | contact | HC_docu... | quality events...               [?]
*Date on this monitor changes at 21:00 UT
png: Information and research:
- png file - advanced studies: QC1 browser | QC1 plotter
Plot
?
Symb
?
Source
*
Average ? Thresholds ? N_
data
QC1
parameter
Data
downloads
Remarks
method value unit method value
1 QC1DB MEDIAN 0.334 ADU VAL0,0.35 3 spat_max_nonunif this | last_yr | all uniformity, IZ band
2 QC1DB MEDIAN 0.3 ADU VAL0,0.35 5 spat_max_nonunif this | last_yr | all uniformity, YJ band
3 QC1DB MEDIAN 0.278 ADU VAL0,0.35 4 spat_max_nonunif this | last_yr | all uniformity, H band
4 QC1DB MEDIAN 0.308 ADU VAL0,0.35 4 spat_max_nonunif this | last_yr | all uniformity, HK band
5 QC1DB MEDIAN 0.13 ADU VAL0,0.35 5 spat_max_nonunif this | last_yr | all uniformity, K band
*Data sources: QC1DB: QC1 database; LOCAL: local data source
Plot 1
scores: 1|
data source:kmos_skyflat
(QC1 database)
dataset:spat_max_nonunif
median:0.334ADU
fixed thresholds:0...0.35ADU
N_data plotted:3
[click plot for closeup]
Plot 2
scores: 1|
data source:kmos_skyflat
(QC1 database)
dataset:spat_max_nonunif
median:0.3ADU
fixed thresholds:0...0.35ADU
N_data plotted:5
[click plot for closeup]
Plot 3
scores: 1|
data source:kmos_skyflat
(QC1 database)
dataset:spat_max_nonunif
median:0.278ADU
fixed thresholds:0...0.35ADU
N_data plotted:4
[click plot for closeup]
Plot 4
scores: 1|
data source:kmos_skyflat
(QC1 database)
dataset:spat_max_nonunif
median:0.308ADU
fixed thresholds:0...0.35ADU
N_data plotted:4
[click plot for closeup]
Plot 5
scores: 1|
data source:kmos_skyflat
(QC1 database)
dataset:spat_max_nonunif
median:0.13ADU
fixed thresholds:0...0.35ADU
N_data plotted:5
[click plot for closeup]
This plot

Three parameters are trended for sky-flats:
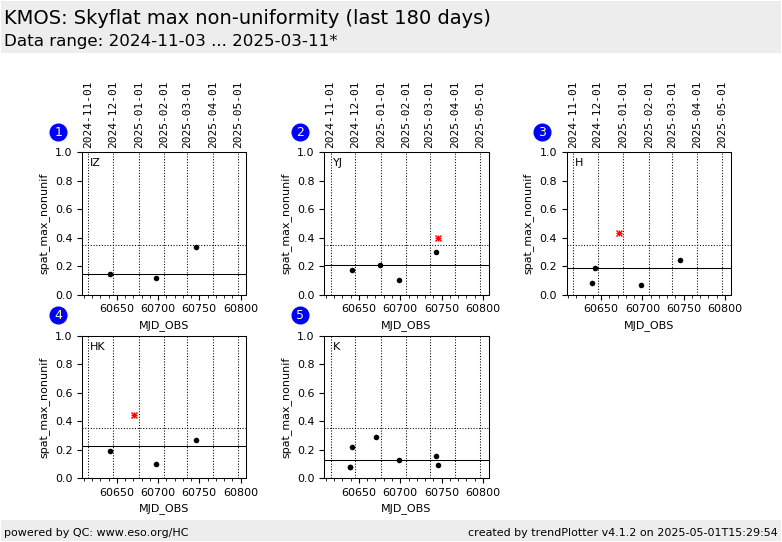
spat_max_nonunif: largest illumination correction rms.
spat_unif: total rms of all illumination correction images
spat_maxdev: mean illumination correction of the most deviating IFU


General information

Click on any of the plots to see a close-up version.

The latest date is indicated on top of the plot.

If configured,

  • data points belonging to the latest date are specially marked
  • statistical averages are indicated by a solid line, and thresholds by broken lines
  • outliers are marked by a red asterisk. They are defined as data points outside the threshold lines
  • "aliens" (= data points outside the plot Y limits) are marked by a red arrow ( or )
  • you can download the data for each parameter set if the 'Data downloads' link shows up