Plot
? |
Symb
? |
Source
* |
Average ? |
Thresholds ? |
N_
data |
QC1
parameter |
Data
downloads |
Remarks |
| method |
value |
unit |
method |
value |
| 1 |
• | QC1DB |
MEDIAN |
|
px |
none | |
0 |
ycenter_ifu17 |
this |
last_yr |
all
|
y centroid of object in acquisition, ifu 17 |
| 2 |
• | QC1DB |
MEDIAN |
7.15 |
px |
none | |
12 |
ycenter_ifu18 |
this |
last_yr |
all
|
y centroid of object in acquisition, ifu 18 |
| 3 |
• | QC1DB |
MEDIAN |
8 |
px |
none | |
8 |
ycenter_ifu19 |
this |
last_yr |
all
|
y centroid of object in acquisition, ifu 19 |
| 4 |
• | QC1DB |
MEDIAN |
8.63 |
px |
none | |
17 |
ycenter_ifu20 |
this |
last_yr |
all
|
y centroid of object in acquisition, ifu 20 |
| 5 |
• | QC1DB |
MEDIAN |
7.04 |
px |
none | |
10 |
ycenter_ifu21 |
this |
last_yr |
all
|
y centroid of object in acquisition, ifu 21 |
| 6 |
• | QC1DB |
MEDIAN |
7.08 |
px |
none | |
38 |
ycenter_ifu22 |
this |
last_yr |
all
|
y centroid of object in acquisition, ifu 22 |
| 7 |
• | QC1DB |
MEDIAN |
8.02 |
px |
none | |
3 |
ycenter_ifu23 |
this |
last_yr |
all
|
y centroid of object in acquisition, ifu 23 |
| 8 |
• | QC1DB |
MEDIAN |
8.11 |
px |
none | |
21 |
ycenter_ifu24 |
this |
last_yr |
all
|
y centroid of object in acquisition, ifu 24 |
| |
|
*Data sources: QC1DB: QC1 database; LOCAL: local data source
|
Plot 1
scores: not implemented
| | data source: | kmos_acq
(QC1 database) |
| dataset: | ycenter_ifu17 | • |
| median: | no data | px |
| thresholds: | none | |
| N_data plotted: | 0 |
| [click plot for closeup] |
Plot 2
scores: not implemented
| | data source: | kmos_acq
(QC1 database) |
| dataset: | ycenter_ifu18 | • |
| median: | 7.15 | px |
| thresholds: | none | |
| N_data plotted: | 12 |
| [click plot for closeup] |
Plot 3
scores: not implemented
| | data source: | kmos_acq
(QC1 database) |
| dataset: | ycenter_ifu19 | • |
| median: | 8 | px |
| thresholds: | none | |
| N_data plotted: | 8 |
| [click plot for closeup] |
Plot 4
scores: not implemented
| | data source: | kmos_acq
(QC1 database) |
| dataset: | ycenter_ifu20 | • |
| median: | 8.63 | px |
| thresholds: | none | |
| N_data plotted: | 17 |
| [click plot for closeup] |
Plot 5
scores: not implemented
| | data source: | kmos_acq
(QC1 database) |
| dataset: | ycenter_ifu21 | • |
| median: | 7.04 | px |
| thresholds: | none | |
| N_data plotted: | 10 |
| [click plot for closeup] |
Plot 6
scores: not implemented
| | data source: | kmos_acq
(QC1 database) |
| dataset: | ycenter_ifu22 | • |
| median: | 7.08 | px |
| thresholds: | none | |
| N_data plotted: | 38 |
| [click plot for closeup] |
Plot 7
scores: not implemented
| | data source: | kmos_acq
(QC1 database) |
| dataset: | ycenter_ifu23 | • |
| median: | 8.02 | px |
| thresholds: | none | |
| N_data plotted: | 3 |
| [click plot for closeup] |
Plot 8
scores: not implemented
| | data source: | kmos_acq
(QC1 database) |
| dataset: | ycenter_ifu24 | • |
| median: | 8.11 | px |
| thresholds: | none | |
| N_data plotted: | 21 |
| [click plot for closeup] |
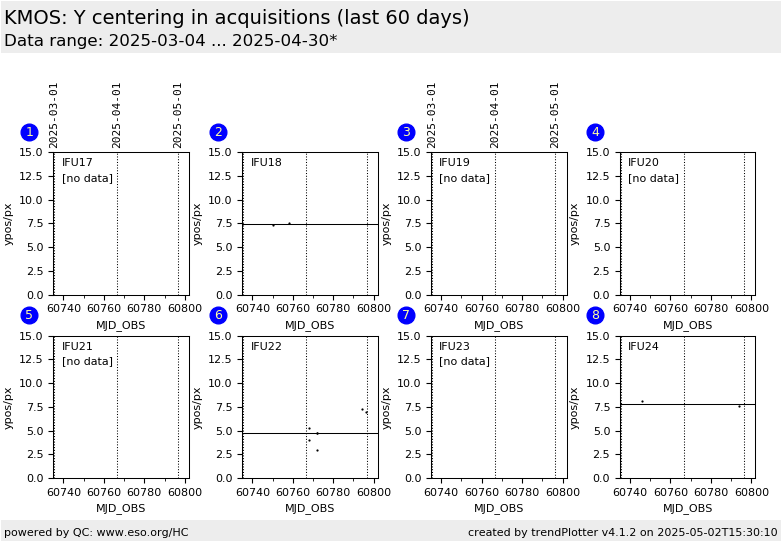
Accuracy of IFU centering in acquisitions.
The dotted red line indicates the center (at x, y = 7.5 px);
the solid black line is the median of the measurements.
The median should match with the center.
General information
Click on any of the plots to see a close-up version.
The latest date is indicated on top of the plot.
If configured,
- data points belonging to the latest date are specially marked
- statistical averages are indicated by a solid line, and thresholds by broken lines
- outliers are marked by a red asterisk. They are defined as data points outside the
threshold lines
- "aliens" (= data points outside the plot Y limits) are marked by a red arrow (↑ or ↓)
- you can download the data for each parameter set if the 'Data downloads' link shows up
|
