|
|
 |
|
|
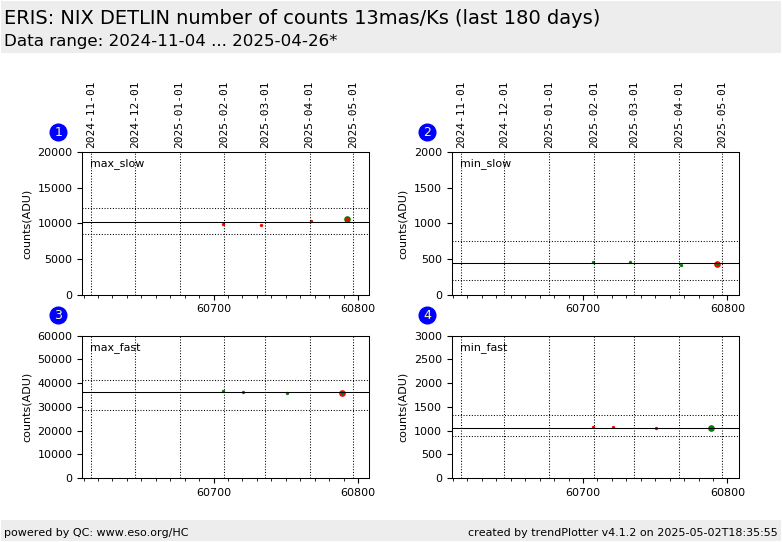
| ERIS trending system: HEALTH CHECK report |
|
|
| Last update: 2026-07-28T12:37:33 (UT)
|
|
|
|
|
| General news: |
NOTE: The Health Check and calChecker services have been moved to qcFlow. These pages are only maintained for comparison
and will be removed in 2026.
|
|
ERIS news:
|
|
Report news:

|
|
|
|
|
|
|

|
|
|
Plot
? |
Symb
? |
Source
* |
Average ? |
Thresholds ? |
N_
data |
QC1
parameter |
Data
downloads |
Remarks |
| method |
value |
unit |
method |
value |
| 1 |
• | QC1DB |
MEDIAN |
9.9e+03 |
ADU |
VAL | 8460,12120 |
5 |
qc_detlin_count_max |
this |
last_yr |
all
|
Maximum median value used in linearity slow readout |
| 2 |
• | QC1DB |
MEDIAN |
444 |
ADU |
VAL | 210,751 |
5 |
qc_detlin_count_min |
this |
last_yr |
all
|
Minimum median value used in linearity slow readout |
| 3 |
• | QC1DB |
MEDIAN |
3.65e+04 |
ADU |
VAL | 28700,41400 |
5 |
qc_detlin_count_max |
this |
last_yr |
all
|
Maximum median value used in linearity fast readout |
| 4 |
• | QC1DB |
MEDIAN |
1.08e+03 |
ADU |
VAL | 896,1333 |
5 |
qc_detlin_count_min |
this |
last_yr |
all
|
Minimum median value used in linearity fast readout |
| |
|
*Data sources: QC1DB: QC1 database; LOCAL: local data source
|
Plot 1
scores:  1| 1|
| | data source: | eris_nix_detlin
(QC1 database) |
| dataset: | qc_detlin_count_max | • |
| median: | 9.9e+03 | ADU |
| fixed thresholds: | 8460...12120 | ADU |
| N_data plotted: | 5 |
| [click plot for closeup] |
Plot 2
scores: 1|
| | data source: | eris_nix_detlin
(QC1 database) |
| dataset: | qc_detlin_count_min | • |
| median: | 444 | ADU |
| fixed thresholds: | 210...751 | ADU |
| N_data plotted: | 5 |
| [click plot for closeup] |
Plot 3
scores: no current data
| | data source: | eris_nix_detlin
(QC1 database) |
| dataset: | qc_detlin_count_max | • |
| median: | 3.65e+04 | ADU |
| fixed thresholds: | 28700...41400 | ADU |
| N_data plotted: | 5 |
| [click plot for closeup] |
Plot 4
scores: no current data
| | data source: | eris_nix_detlin
(QC1 database) |
| dataset: | qc_detlin_count_min | • |
| median: | 1.08e+03 | ADU |
| fixed thresholds: | 896...1333 | ADU |
| N_data plotted: | 5 |
| [click plot for closeup] |
Non linearity coefficients and badpixels
General information
Click on any of the plots to see a close-up version.
The latest date is indicated on top of the plot.
If configured,
- data points belonging to the latest date are specially marked
- statistical averages are indicated by a solid line, and thresholds by broken lines
- outliers are marked by a red asterisk. They are defined as data points outside the
threshold lines
- "aliens" (= data points outside the plot Y limits) are marked by a red arrow (↑ or ↓)
- you can download the data for each parameter set if the 'Data downloads' link shows up
|
|
|