|
|
 |
|
|
| ERIS trending system: HEALTH CHECK report |
|
|
| Last update: 2026-07-27T18:19:14 (UT)
|
|
|
|
|
| General news: |
NOTE: The Health Check and calChecker services have been moved to qcFlow. These pages are only maintained for comparison
and will be removed in 2026.
|
|
ERIS news:
|
|
Report news:

|
|
|
|
|
|
|

|
|
|
Plot
? |
Symb
? |
Source
* |
Average ? |
Thresholds ? |
N_
data |
QC1
parameter |
Data
downloads |
Remarks |
| method |
value |
unit |
method |
value |
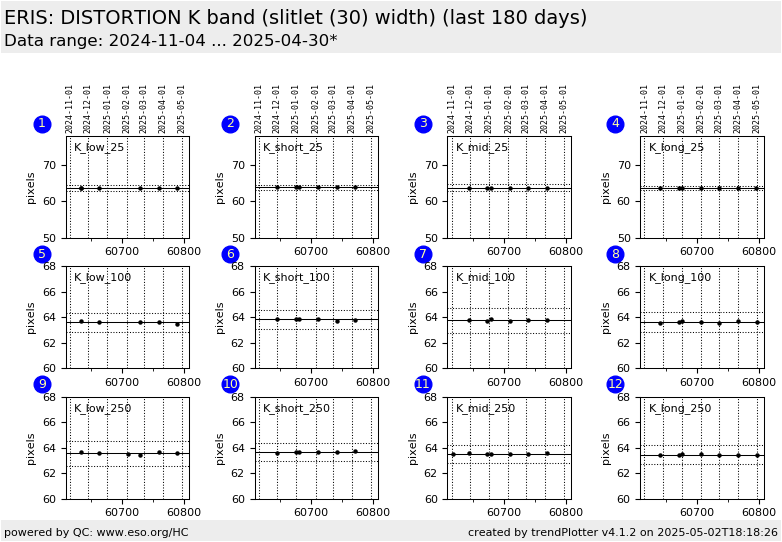
| 1 |
• | QC1DB |
MEDIAN |
63.6 |
pixels |
VAL | 62.783,64.503 |
5 |
qc_s30_RminusL_med |
this |
last_yr |
all
|
width_slitlet31_right (pixels):: K_low/25 mas scale |
| 2 |
• | QC1DB |
MEDIAN |
63.8 |
pixels |
VAL | 63.086,64.61 |
5 |
qc_s30_RminusL_med |
this |
last_yr |
all
|
width_slitlet31_right (pixels):: K_short/25 mas scale |
| 3 |
• | QC1DB |
MEDIAN |
63.8 |
pixels |
VAL | 62.829,64.623 |
5 |
qc_s30_RminusL_med |
this |
last_yr |
all
|
width_slitlet31_right (pixels):: K_middle/25 mas scale |
| 4 |
• | QC1DB |
MEDIAN |
63.6 |
pixels |
VAL | 62.989,64.295 |
5 |
qc_s30_RminusL_med |
this |
last_yr |
all
|
width_slitlet31_right (pixels):: K_long/25 mas scale |
| 5 |
• | QC1DB |
MEDIAN |
63.7 |
pixels |
VAL | 62.857,64.358 |
6 |
qc_s30_RminusL_med |
this |
last_yr |
all
|
width_slitlet31_right (pixels):: K_low/100 mas scale |
| 6 |
• | QC1DB |
MEDIAN |
63.9 |
pixels |
VAL | 63.054,64.583 |
5 |
qc_s30_RminusL_med |
this |
last_yr |
all
|
width_slitlet31_right (pixels):: K_short/100 mas scale |
| 7 |
• | QC1DB |
MEDIAN |
63.8 |
pixels |
VAL | 62.773,64.717 |
5 |
qc_s30_RminusL_med |
this |
last_yr |
all
|
width_slitlet31_right (pixels):: K_middle/100 mas scale |
| 8 |
• | QC1DB |
MEDIAN |
63.7 |
pixels |
VAL | 62.852,64.413 |
5 |
qc_s30_RminusL_med |
this |
last_yr |
all
|
width_slitlet31_right (pixels):: K_long/100 mas scale |
| 9 |
• | QC1DB |
MEDIAN |
63.6 |
pixels |
VAL | 62.55,64.52 |
6 |
qc_s30_RminusL_med |
this |
last_yr |
all
|
width_slitlet31_right (pixels):: K_low/250 mas scale |
| 10 |
• | QC1DB |
MEDIAN |
63.7 |
pixels |
VAL | 62.924,64.379 |
5 |
qc_s30_RminusL_med |
this |
last_yr |
all
|
width_slitlet31_right (pixels):: K_short/250 mas scale |
| 11 |
• | QC1DB |
MEDIAN |
63.5 |
pixels |
VAL | 62.782,64.196 |
5 |
qc_s30_RminusL_med |
this |
last_yr |
all
|
width_slitlet31_right (pixels):: K_middle/250 mas scale |
| 12 |
• | QC1DB |
MEDIAN |
63.5 |
pixels |
VAL | 62.728,64.204 |
7 |
qc_s30_RminusL_med |
this |
last_yr |
all
|
width_slitlet31_right (pixels):: K_long/250 mas scale |
| |
|
*Data sources: QC1DB: QC1 database; LOCAL: local data source
|
Plot 1
scores: no current data
| | data source: | eris_ifu_distortion
(QC1 database) |
| dataset: | qc_s30_RminusL_med | • |
| median: | 63.6 | pixels |
| fixed thresholds: | 62.783...64.503 | pixels |
| N_data plotted: | 5 |
| [click plot for closeup] |
Plot 2
scores: no current data
| | data source: | eris_ifu_distortion
(QC1 database) |
| dataset: | qc_s30_RminusL_med | • |
| median: | 63.8 | pixels |
| fixed thresholds: | 63.086...64.61 | pixels |
| N_data plotted: | 5 |
| [click plot for closeup] |
Plot 3
scores: no current data
| | data source: | eris_ifu_distortion
(QC1 database) |
| dataset: | qc_s30_RminusL_med | • |
| median: | 63.8 | pixels |
| fixed thresholds: | 62.829...64.623 | pixels |
| N_data plotted: | 5 |
| [click plot for closeup] |
Plot 4
scores: no current data
| | data source: | eris_ifu_distortion
(QC1 database) |
| dataset: | qc_s30_RminusL_med | • |
| median: | 63.6 | pixels |
| fixed thresholds: | 62.989...64.295 | pixels |
| N_data plotted: | 5 |
| [click plot for closeup] |
Plot 5
scores: no current data
| | data source: | eris_ifu_distortion
(QC1 database) |
| dataset: | qc_s30_RminusL_med | • |
| median: | 63.7 | pixels |
| fixed thresholds: | 62.857...64.358 | pixels |
| N_data plotted: | 6 |
| [click plot for closeup] |
Plot 6
scores: no current data
| | data source: | eris_ifu_distortion
(QC1 database) |
| dataset: | qc_s30_RminusL_med | • |
| median: | 63.9 | pixels |
| fixed thresholds: | 63.054...64.583 | pixels |
| N_data plotted: | 5 |
| [click plot for closeup] |
Plot 7
scores: no current data
| | data source: | eris_ifu_distortion
(QC1 database) |
| dataset: | qc_s30_RminusL_med | • |
| median: | 63.8 | pixels |
| fixed thresholds: | 62.773...64.717 | pixels |
| N_data plotted: | 5 |
| [click plot for closeup] |
Plot 8
scores: no current data
| | data source: | eris_ifu_distortion
(QC1 database) |
| dataset: | qc_s30_RminusL_med | • |
| median: | 63.7 | pixels |
| fixed thresholds: | 62.852...64.413 | pixels |
| N_data plotted: | 5 |
| [click plot for closeup] |
Plot 9
scores: no current data
| | data source: | eris_ifu_distortion
(QC1 database) |
| dataset: | qc_s30_RminusL_med | • |
| median: | 63.6 | pixels |
| fixed thresholds: | 62.55...64.52 | pixels |
| N_data plotted: | 6 |
| [click plot for closeup] |
Plot 10
scores: no current data
| | data source: | eris_ifu_distortion
(QC1 database) |
| dataset: | qc_s30_RminusL_med | • |
| median: | 63.7 | pixels |
| fixed thresholds: | 62.924...64.379 | pixels |
| N_data plotted: | 5 |
| [click plot for closeup] |
Plot 11
scores: no current data
| | data source: | eris_ifu_distortion
(QC1 database) |
| dataset: | qc_s30_RminusL_med | • |
| median: | 63.5 | pixels |
| fixed thresholds: | 62.782...64.196 | pixels |
| N_data plotted: | 5 |
| [click plot for closeup] |
Plot 12
scores: no current data
| | data source: | eris_ifu_distortion
(QC1 database) |
| dataset: | qc_s30_RminusL_med | • |
| median: | 63.5 | pixels |
| fixed thresholds: | 62.728...64.204 | pixels |
| N_data plotted: | 7 |
| [click plot for closeup] |
Click on any of the plots to see a close-up version.
The latest date is indicated on top of the plot.
If configured,
- data points belonging to the latest date are specially marked
- statistical averages are indicated by a solid line, and thresholds by broken lines
- outliers are marked by a red asterisk. They are defined as data points outside the
threshold lines
- "aliens" (= data points outside the plot Y limits) are marked by a red arrow (↑ or ↓)
- you can download the data for each parameter set if the 'Data downloads' link shows up
|
|
|