|
|
| ERIS trending system: HEALTH CHECK report |
|
|
| Last update: 2026-07-29T18:02:44 (UT)
|
|
|
|
|
| General news: |
NOTE: The Health Check and calChecker services have been moved to qcFlow. These pages are only maintained for comparison
and will be removed in 2026.
|
|
ERIS news:
|
|
Report news:

|
|
|
|
|
|
|

|
|
|
Plot
? |
Symb
? |
Source
* |
Average ? |
Thresholds ? |
N_
data |
QC1
parameter |
Data
downloads |
Remarks |
| method |
value |
unit |
method |
value |
| 1 |
• | QC1DB |
MEDIAN |
32.9 |
ADU |
none | |
10 |
qc_masterdark_mean |
this |
last_yr |
all
|
Clean mean of master dark level |
| 2 |
• | QC1DB |
MEDIAN |
8.47 |
ADU |
none | |
10 |
qc_masterdark_stdev |
this |
last_yr |
all
|
Clean standard deviation of master dark |
| 3 |
• | QC1DB |
MEDIAN |
3.81 |
ADU |
none | |
10 |
qc_darkfpn |
this |
last_yr |
all
|
fixed pattern noise |
| 4 |
• | QC1DB |
MEDIAN |
4.68e+04 |
number |
none | |
10 |
qc_dark_nbadpix |
this |
last_yr |
all
|
number of bad pixels |
| 5 |
• | QC1DB |
MEDIAN |
|
ADU |
none | |
0 |
qc_dark_n_nan |
this |
last_yr |
all
|
number of pixels "nan" in the master dark |
| 6 |
• | QC1DB |
MEDIAN |
0.0112 |
number |
none | |
10 |
qc_dark_bpixfrac |
this |
last_yr |
all
|
fraction of bad pixels in the master dark |
| |
|
*Data sources: QC1DB: QC1 database; LOCAL: local data source
|
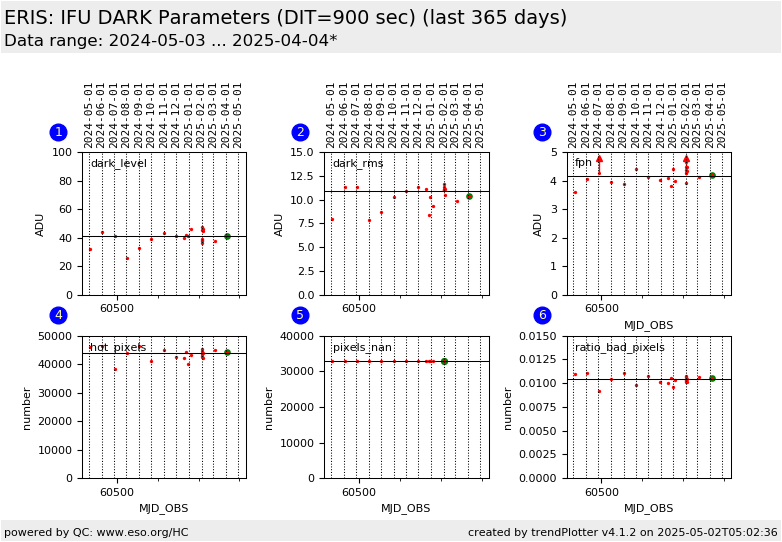
Plot 1
scores: not implemented
| | data source: | eris_ifu_dark
(QC1 database) |
| dataset: | qc_masterdark_mean | • |
| median: | 32.9 | ADU |
| thresholds: | none | |
| N_data plotted: | 10 |
| [click plot for closeup] |
Plot 2
scores: not implemented
| | data source: | eris_ifu_dark
(QC1 database) |
| dataset: | qc_masterdark_stdev | • |
| median: | 8.47 | ADU |
| thresholds: | none | |
| N_data plotted: | 10 |
| [click plot for closeup] |
Plot 3
scores: not implemented
| | data source: | eris_ifu_dark
(QC1 database) |
| dataset: | qc_darkfpn | • |
| median: | 3.81 | ADU |
| thresholds: | none | |
| N_data plotted: | 10 |
| [click plot for closeup] |
Plot 4
scores: not implemented
| | data source: | eris_ifu_dark
(QC1 database) |
| dataset: | qc_dark_nbadpix | • |
| median: | 4.68e+04 | number |
| thresholds: | none | |
| N_data plotted: | 10 |
| [click plot for closeup] |
Plot 5
scores: not implemented
| | data source: | eris_ifu_dark
(QC1 database) |
| dataset: | qc_dark_n_nan | • |
| median: | no data | ADU |
| thresholds: | none | |
| N_data plotted: | 0 |
| [click plot for closeup] |
Plot 6
scores: not implemented
| | data source: | eris_ifu_dark
(QC1 database) |
| dataset: | qc_dark_bpixfrac | • |
| median: | 0.0112 | number |
| thresholds: | none | |
| N_data plotted: | 10 |
| [click plot for closeup] |
The main qc parameters are plotted for the mostly used DITs
General information
Click on any of the plots to see a close-up version.
The latest date is indicated on top of the plot.
If configured,
- data points belonging to the latest date are specially marked
- statistical averages are indicated by a solid line, and thresholds by broken lines
- outliers are marked by a red asterisk. They are defined as data points outside the
threshold lines
- "aliens" (= data points outside the plot Y limits) are marked by a red arrow (↑ or ↓)
- you can download the data for each parameter set if the 'Data downloads' link shows up
|
|