Plot
? |
Symb
? |
Source
* |
Average ? |
Thresholds ? |
N_
data |
QC1
parameter |
Data
downloads |
Remarks |
| method |
value |
unit |
method |
value |
| 1 |
• | QC1DB |
MEDIAN |
8.17e+04 |
NONE |
VAL | 60000.0,110000.0 |
58 |
resol_07_01 |
this |
last_yr |
all
|
RESOL_07_01, wlen_id=J1228, w_0.2, CHIP1 |
| 2 |
• | QC1DB |
MEDIAN |
9.79e+04 |
NONE |
VAL | 92000.0,106000.0 |
58 |
resol_07_01 |
this |
last_yr |
all
|
RESOL_07_01, wlen_id=J1228, w_0.2, CHIP2 |
| 3 |
• | QC1DB |
MEDIAN |
9.21e+04 |
NONE |
VAL | 60000.0,110000.0 |
58 |
resol_07_01 |
this |
last_yr |
all
|
RESOL_07_01, wlen_id=J1228, w_0.2, CHIP3 |
| 4 |
• | QC1DB |
MEDIAN |
3.69 |
NONE |
none | |
58 |
resolfwhm_07_01 |
this |
last_yr |
all
|
RESOLFWHM_07_01, wlen_id=J1228, w_0.2, CHIP1 |
| 5 |
• | QC1DB |
MEDIAN |
3.25 |
NONE |
none | |
58 |
resolfwhm_07_01 |
this |
last_yr |
all
|
RESOLFWHM_07_01, wlen_id=J1228, w_0.2, CHIP2 |
| 6 |
• | QC1DB |
MEDIAN |
3.66 |
NONE |
none | |
58 |
resolfwhm_07_01 |
this |
last_yr |
all
|
RESOLFWHM_07_01, wlen_id=J1228, w_0.2, CHIP3 |
| |
|
*Data sources: QC1DB: QC1 database; LOCAL: local data source
|
Plot 1
scores:  8| 8|
| | data source: | criresp_wave
(QC1 database) |
| dataset: | resol_07_01 | • |
| median: | 8.17e+04 | NONE |
| fixed thresholds: | 60000.0...110000.0 | NONE |
| N_data plotted: | 58 |
| [click plot for closeup] |
Plot 2
scores: 8|
| | data source: | criresp_wave
(QC1 database) |
| dataset: | resol_07_01 | • |
| median: | 9.79e+04 | NONE |
| fixed thresholds: | 92000.0...106000.0 | NONE |
| N_data plotted: | 58 |
| [click plot for closeup] |
Plot 3
scores: 8|
| | data source: | criresp_wave
(QC1 database) |
| dataset: | resol_07_01 | • |
| median: | 9.21e+04 | NONE |
| fixed thresholds: | 60000.0...110000.0 | NONE |
| N_data plotted: | 58 |
| [click plot for closeup] |
Plot 4
scores: no current data
| | data source: | criresp_wave
(QC1 database) |
| dataset: | resolfwhm_07_01 | • |
| median: | 3.69 | NONE |
| thresholds: | none | |
| N_data plotted: | 58 |
| [click plot for closeup] |
Plot 5
scores: no current data
| | data source: | criresp_wave
(QC1 database) |
| dataset: | resolfwhm_07_01 | • |
| median: | 3.25 | NONE |
| thresholds: | none | |
| N_data plotted: | 58 |
| [click plot for closeup] |
Plot 6
scores: no current data
| | data source: | criresp_wave
(QC1 database) |
| dataset: | resolfwhm_07_01 | • |
| median: | 3.66 | NONE |
| thresholds: | none | |
| N_data plotted: | 58 |
| [click plot for closeup] |
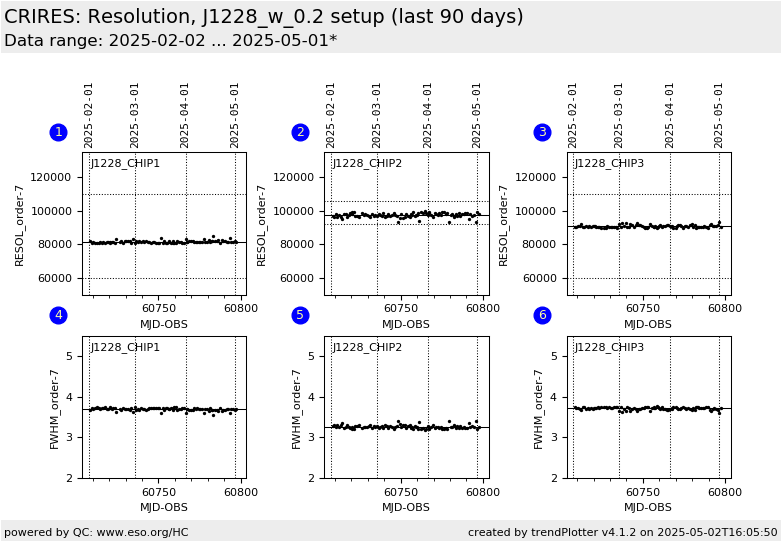
Trending plot for the WAVE resolution in the CRIRES+ WAVE exposures
for each of the detectors. It is monitored on the order 7 of the WAVE
calibrations.
Only calibrations in INS.WLEN.ID=J1228, INS.SLIT1.WIDTH=0.2
arcsec, taken with metrology (OCS.MTRLGY.ST = T) are selected. The
sub-plots correspond to the resolution for each detector.
General information
Click on any of the plots to see a close-up version.
The latest date is indicated on top of the plot.
If configured,
- data points belonging to the latest date are specially marked
- statistical averages are indicated by a solid line, and thresholds by broken lines
- outliers are marked by a red asterisk. They are defined as data points outside the
threshold lines
- "aliens" (= data points outside the plot Y limits) are marked by a red arrow (↑ or ↓)
- you can download the data for each parameter set if the 'Data downloads' link shows up
|
