EUROPEAN SOUTHERN OBSERVATORY |
|
SciOps Technical Report: |
| Prepared | Olivier Hainaut | 2003-05-07 |
| 0.1 |
2003-05-05 first draft, ohainaut |
| 1.1 | 2003-05-07 released, ohainaut |
PinHole images obtained with SuSI-2 are analyzed, confirming that the baffling is defficient.
A study of the stability of the SuSI-2 flatfield with rotator position was performed, indicating a strong light excess in a direction correlated with the position of the rotator. This study, available in [1], suggested a problem with the baffling of the instrument. In the framework of a general improvement of the baffles of the La Silla Telescopes by LED/OPT, lead by A.Gilliotte, pinhole tests were performed SuSI2.
SciOp: La Silla Science Operation Department
LED: La Silla Engineering Department
SuSI2: Superb Seeing Imager on the NTT
NTT: New Technology Telecope
Pinhole images (i.e. mounting a plate with a pinhole in the filter wheel) were obtained on April 27, 2003. The telescope was pointing to the FlatField screen. The raw files are listed below. The first set was obtained with the M3 baffle up, the second with the baffle retracted.
Baffle Up:
ONTT.2003-04-27T14:16:30.411.fits
ONTT.2003-04-27T14:17:56.956.fits
ONTT.2003-04-27T14:18:59.961.fits
ONTT.2003-04-27T14:19:46.832.fits
ONTT.2003-04-27T14:20:40.740.fits
ONTT.2003-04-27T14:21:50.122.fits
ONTT.2003-04-27T14:22:34.354.fits
ONTT.2003-04-27T14:23:17.557.fits
Baffle Down:
ONTT.2003-04-27T14:38:02.937.fits
ONTT.2003-04-27T14:39:04.363.fits
ONTT.2003-04-27T14:39:57.063.fits
ONTT.2003-04-27T14:40:24.043.fits
ONTT.2003-04-27T14:42:22.486.fits
Figure 1 displays the pinhole image with M3 baffle up, at two different threshold levels.
Figure 2 displays the pinhole image with M3 baffle up, down, and Figure 3 shows the normalized ratio of both.
All images presented have been bias subtracted. The analysis presented below was performed on these bias subtracted frames.

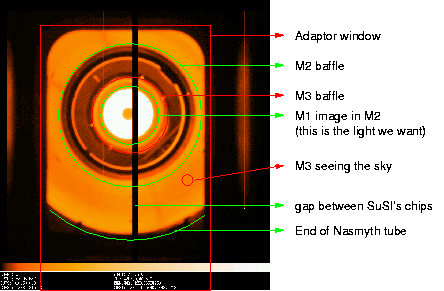
Figure 1.a: PinHole image obtained with M3 baffle up. Threshold adjusted
to reveal the low light levels (0 to 5000 adu, log color scale). The second
panel is a legent of the various elements visible. Larger version of the images
are available by clicking on them.

Figure 1.b: same image as in Fig.1.a, with the threshold adjusted to reveal
the high light levels (300 to 10000 adu, log color scale
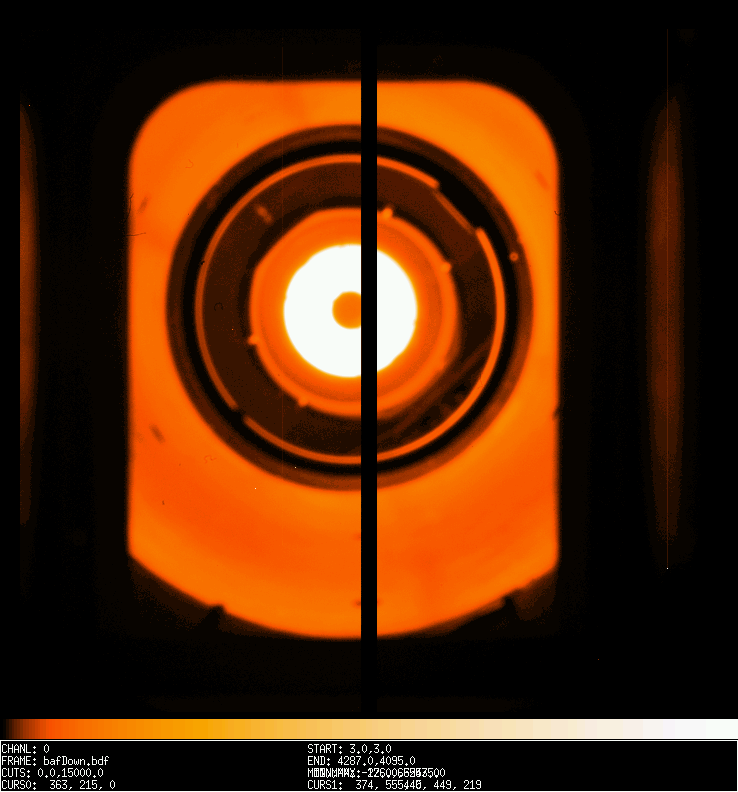
Figure 2: Pinhole image obtained with M3 baffle down, with the same threshold
as for Fig.1.b.
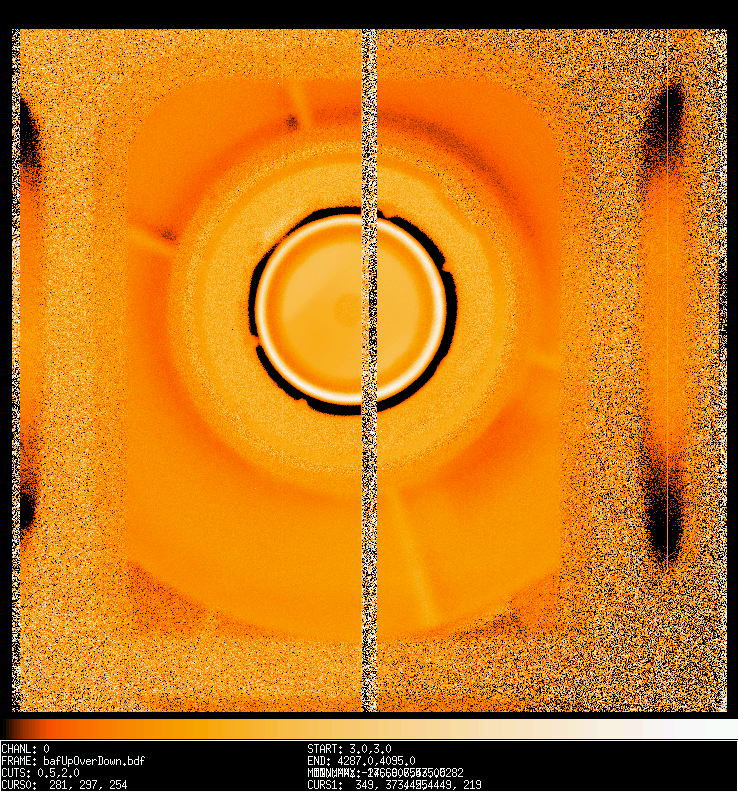
Figure 3: ratio of the pinhole image with baffle up over that with baffle
down. The ratio is normalized to unity over the area of the central M1 mirror
image, the thresholds are set to 1/2, 2.
Figure 1 shows clearly that
In order to quantify the effect of the contamination caused by the direct line of sight to the sky over M3, the various light contributions were measured:
In summary, the direct light from M3 represents 48% of the signal, and the stray light 2.6%.
A baffle letting only the light from M1+M2+M3 is therefore needed. It is expected to reduce the background level to ~67% of its current value, which will cause an increase of ~20% in the S/N of most astronomical images.
To measure the effect of the M3 baffle, the values of the "baffle up" over "baffle down" image (Fig.3) was integrated over the central region. This indicates a decrease of 8% of the background in that region. Obviously, the systematic use of the M3 baffle will become even more critical when the Nastmyth baffling will be improved.
--oOo--