|
|
| Workflow information system for QC |
|
|
| Last update: 2026-07-27T14:54:23 (UT)
|
|
| now:
2026-07-28T14:11:46
(UT) |
|
|
|
|
|
| General news: |
NOTE: The Health Check and calChecker services have been moved to qcFlow. These pages are only maintained for comparison
and will be removed in 2026.
|
Report news:

|
gap between 2008-11 and 2009-03: no operations
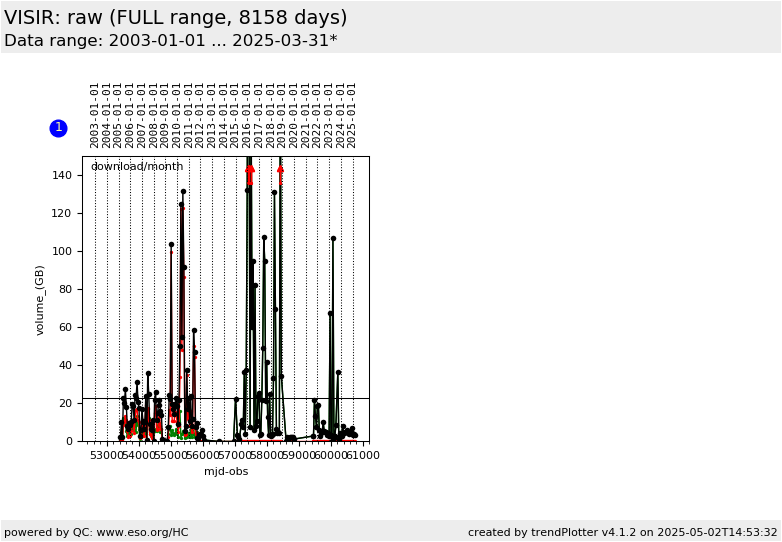
since 2010-04: burst mode data blow up the data volume
|
|
|
|

|
|
|
Plot
? |
Symb
? |
Source
* |
Average ? |
Thresholds ? |
N_
data |
QC1
parameter |
Data
downloads |
Remarks |
| method |
value |
unit |
method |
value |
| 1 |
• | QC1DB |
none |
|
GB/month |
none | |
191 |
GB_CAL_RAW |
all (full time range)
| VISIR: processed raw data per month [GB]
a) Calibrations |
| 1 |
• | QC1DB |
none |
|
GB/month |
none | |
191 |
GB_SCI_RAW |
all (full time range)
| b) Science |
| 1 |
• | QC1DB |
MEAN |
22.3 |
GB/month |
none | |
191 |
GB_ALL_RAW |
all (full time range)
| c) ALL data types |
| |
|
*Data sources: QC1DB: QC1 database; LOCAL: local data source
|
| Plot 1 | | data source: | monthly_stat
(QC1 database) |
dataset:
(numbers below apply to this dataset) | GB_CAL_RAW | • |
| average: | none |
| thresholds: | none |
| N_data plotted: | 191 |
| [click plot for closeup] |
Click on any of the plots to see a close-up version.
The latest date is indicated on top of the plot.
If configured,
- data points belonging to the latest date are specially marked
- statistical averages are indicated by a solid line, and thresholds by broken lines
- outliers are marked by a red asterisk. They are defined as data points outside the
threshold lines
- "aliens" (= data points outside the plot Y limits) are marked by a red arrow (↑ or ↓)
- you can download the data for each parameter set if the 'Data downloads' link shows up
|