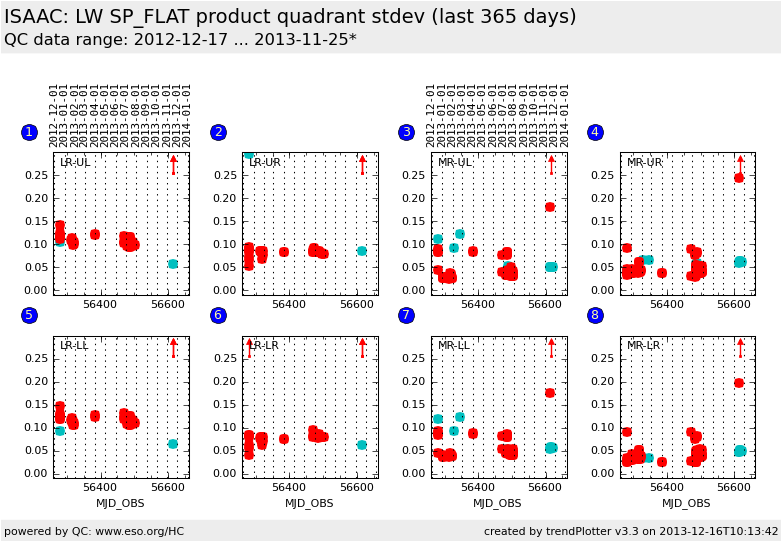
ISAAC trending system: HEALTH CHECK report
Last update: 2013-12-16T10:13:53 (UT)
[enable javascript for displaying time difference!]
General news:
NOTE: The Health Check and calChecker services have been moved to qcFlow. These pages are only maintained for comparison
and will be removed in 2026.
ISAAC news:
2013-12-16: due to ISAAC decommissioning, refreshing of the health checks disabled
Report news:
Plot? Symb? Source OPS? Average ? Thresholds ? N_ QC1 Data Remarks
method value unit method value
1
• QC1DB no none ADU none 2 std_UL
this |
last_yr |
all
Product Flat quadrant stdev for LW, LR, M
1
• QC1DB no none ADU none 36 std_UL
this |
last_yr |
all
Product Flat quadrant stdev for LW, LR, SL
2
• QC1DB no none ADU none 2 std_UR
this |
last_yr |
all
Product Flat quadrant stdev for LW, LR, M
2
• QC1DB no none ADU none 36 std_UR
this |
last_yr |
all
Product Flat quadrant stdev for LW, LR, SL
3
• QC1DB no none ADU none 13 std_UL
this |
last_yr |
all
Product Flat quadrant stdev for LW, MR, M
3
• QC1DB no none ADU none 106 std_UL
this |
last_yr |
all
Product Flat quadrant stdev for LW, MR, SL
4
• QC1DB no none ADU none 13 std_UR
this |
last_yr |
all
Product Flat quadrant stdev for LW, MR, M
4
• QC1DB no none ADU none 106 std_UR
this |
last_yr |
all
Product Flat quadrant stdev for LW, MR, SL
5
• QC1DB no none ADU none 2 std_LL
this |
last_yr |
all
Product Flat quadrant stdev for LW, LR, M
5
• QC1DB no none ADU none 36 std_LL
this |
last_yr |
all
Product Flat quadrant stdev for LW, LR, SL
6
• QC1DB no none ADU none 2 std_LR
this |
last_yr |
all
Product Flat quadrant stdev for LW, LR, M
6
• QC1DB no none ADU none 36 std_LR
this |
last_yr |
all
Product Flat quadrant stdev for LW, LR, SL
7
• QC1DB no none ADU none 13 std_LL
this |
last_yr |
all
Product Flat quadrant stdev for LW, MR, M
7
• QC1DB no none ADU none 106 std_LL
this |
last_yr |
all
Product Flat quadrant stdev for LW, MR, SL
8
• QC1DB no none ADU none 13 std_LR
this |
last_yr |
all
Product Flat quadrant stdev for LW, MR, M
8
• QC1DB no none ADU none 106 std_LR
this |
last_yr |
all
Product Flat quadrant stdev for LW, MR, SL
*Data sources: QC1DB: QC1 database; LOCAL: local text file | **OPS: OPSLOG data are included
Plot 1 scores: not implemented
data source: isaac_spflat dataset: std_UL • average: none thresholds: none N_data plotted: 2 [click on plot for closeup]
Plot 2 scores: not implemented
data source: isaac_spflat dataset: std_UR • average: none thresholds: none N_data plotted: 2 [click on plot for closeup]
Plot 3 scores: not implemented
data source: isaac_spflat dataset: std_UL • average: none thresholds: none N_data plotted: 13 [click on plot for closeup]
Plot 4 scores: not implemented
data source: isaac_spflat dataset: std_UR • average: none thresholds: none N_data plotted: 13 [click on plot for closeup]
Plot 5 scores: not implemented
data source: isaac_spflat dataset: std_LL • average: none thresholds: none N_data plotted: 2 [click on plot for closeup]
Plot 6 scores: not implemented
data source: isaac_spflat dataset: std_LR • average: none thresholds: none N_data plotted: 2 [click on plot for closeup]
Plot 7 scores: not implemented
data source: isaac_spflat dataset: std_LL • average: none thresholds: none N_data plotted: 13 [click on plot for closeup]
Plot 8 scores: not implemented
data source: isaac_spflat dataset: std_LR • average: none thresholds: none N_data plotted: 13 [click on plot for closeup]
General information
Click on any of the plots to see a close-up version .
The latest date is indicated on top of the plot, data points belonging to that date are specially marked.
If configured,
statistical averages are indicated by a solid line, and thresholds by broken lines outliers are marked by a red asterisk. They are defined as data points outside the
threshold lines "aliens" (= data points outside the plot Y limits) are marked by a red arrow (↑ ↓ you can download the data for each parameter set if the 'Data downloads' link shows up

