GRAVITY trending system: HEALTH CHECK report
Last update: 2026-07-28T12:33:06 (UT)
[enable javascript for displaying time difference!]
General news:
NOTE: The Health Check and calChecker services have been moved to qcFlow. These pages are only maintained for comparison
and will be removed in 2026.
GRAVITY news:
Report news:
Plot? Symb? Source Average ? Thresholds ? N_ QC1 Data Remarks
method value unit method value
1
• QC1DB MEDIAN 2 none VAL 0,5 3 badpix_sc
this |
last_yr |
all
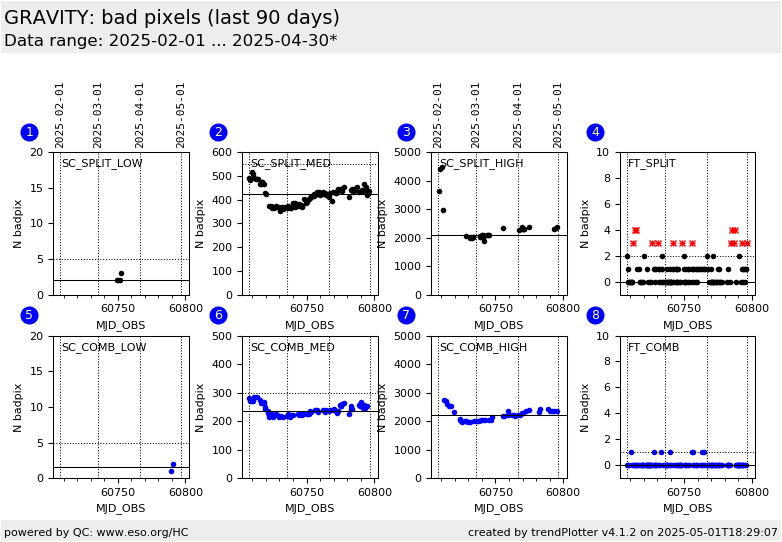
number of bad pixels, LOW resolution, Science Camera (SC) detector, SPLIT polarisation
2
• QC1DB MEDIAN 479 none VAL 0,550 96 badpix_sc
this |
last_yr |
all
number of bad pixels, MEDIUM resolution, Science Camera (SC) detector, SPLIT polarisation
3
• QC1DB MEDIAN 2.51e+03 none VAL 0,6000 39 badpix_sc
this |
last_yr |
all
number of bad pixels, HIGH resolution, Science Camera (SC) detector, SPLIT polarisation
4
• QC1DB MEDIAN 0 none VAL 0,2 138 badpix_ft
this |
last_yr |
all
number of bad pixels, Fringe Tracker (FT) detector, SPLIT polarisation
5
• QC1DB MEDIAN 1 none VAL 0,5 9 badpix_sc
this |
last_yr |
all
number of bad pixels, LOW resolution, Science Camera (SC) detector, COMBINED polarisation
6
• QC1DB MEDIAN 268 none VAL 0,300 82 badpix_sc
this |
last_yr |
all
number of bad pixels, MEDIUM resolution, Science Camera (SC) detector, COMBINED polarisation
7
• QC1DB MEDIAN 2.47e+03 none VAL 0,6000 54 badpix_sc
this |
last_yr |
all
number of bad pixels, HIGH resolution, Science Camera (SC) detector, COMBINED polarisation
8
• QC1DB MEDIAN 0 none VAL 0,1 145 badpix_ft
this |
last_yr |
all
number of bad pixels, Fringe Tracker (FT) detector, COMBINED polarisation
*Data sources: QC1DB: QC1 database; LOCAL: local data source
Plot 1 scores: 1 |
data source: gravity_p2vm dataset: badpix_sc • median: 2 none fixed thresholds: 0...5 none N_data plotted: 3 [click plot for closeup]
Plot 2 scores: 10 |
data source: gravity_p2vm dataset: badpix_sc • median: 479 none fixed thresholds: 0...550 none N_data plotted: 96 [click plot for closeup]
Plot 3 scores: 2 |
data source: gravity_p2vm dataset: badpix_sc • median: 2.51e+03 none fixed thresholds: 0...6000 none N_data plotted: 39 [click plot for closeup]
Plot 4 scores: 12 |
data source: gravity_p2vm dataset: badpix_ft • median: 0 none fixed thresholds: 0...2 none N_data plotted: 138 [click plot for closeup]
Plot 5 scores: 1 |
data source: gravity_p2vm dataset: badpix_sc • median: 1 none fixed thresholds: 0...5 none N_data plotted: 9 [click plot for closeup]
Plot 6 scores: 10 |
data source: gravity_p2vm dataset: badpix_sc • median: 268 none fixed thresholds: 0...300 none N_data plotted: 82 [click plot for closeup]
Plot 7 scores: 4 |
data source: gravity_p2vm dataset: badpix_sc • median: 2.47e+03 none fixed thresholds: 0...6000 none N_data plotted: 54 [click plot for closeup]
Plot 8 scores: 12 |
data source: gravity_p2vm dataset: badpix_ft • median: 0 none fixed thresholds: 0...1 none N_data plotted: 145 [click plot for closeup]
This plot
Trending plot for the number of bad pixels of the Fringe Tracker (FT) and Science Camera
(SC) detectors. Values are determined from flat-field measurements.
General information
Click on any of the plots to see a close-up version .
The latest date is indicated on top of the plot.
If configured,
data points belonging to the latest date are specially marked statistical averages are indicated by a solid line, and thresholds by broken lines outliers are marked by a red asterisk. They are defined as data points outside the
threshold lines "aliens" (= data points outside the plot Y limits) are marked by a red arrow (↑ ↓ you can download the data for each parameter set if the 'Data downloads' link shows up
