Plot
? |
Symb
? |
Source
* |
Average ? |
Thresholds ? |
N_
data |
QC1
parameter |
Data
downloads |
Remarks |
| method |
value |
unit |
method |
value |
| 1 |
• | QC1DB |
MEDIAN |
388 |
NONE |
VAL | 350,400 |
13 |
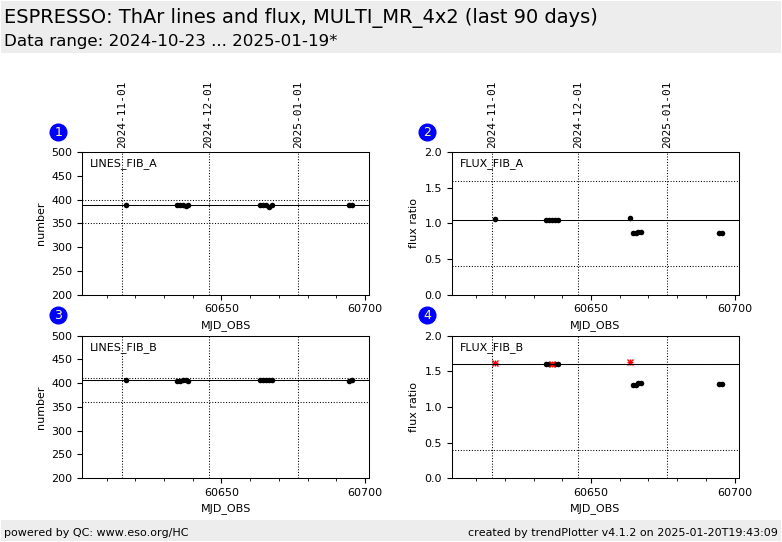
fiba_thar_lines_tot |
this |
last_yr |
all
|
total number of ThAr lines, fibre A |
| 2 |
• | QC1DB |
MEDIAN |
1.05 |
NONE |
VAL | 0.4,1.6 |
13 |
fiba_thar_flux_ratio |
this |
last_yr |
all
|
median flux ratio of ThAr lines to reference line table, fibre A |
| 3 |
• | QC1DB |
MEDIAN |
406 |
NONE |
VAL | 360,410 |
13 |
fibb_thar_lines_tot |
this |
last_yr |
all
|
total number of ThAr lines, fibre B |
| 4 |
• | QC1DB |
MEDIAN |
1.59 |
NONE |
VAL | 0.4,1.6 |
13 |
fibb_thar_flux_ratio |
this |
last_yr |
all
|
median flux ratio of ThAr lines to reference line table, fibre B |
| |
|
*Data sources: QC1DB: QC1 database; LOCAL: local data source
|
Plot 1
scores:  2| 2|
| | data source: | espresso_wave_thar_a
(QC1 database) |
| dataset: | fiba_thar_lines_tot | • |
| median: | 388 | NONE |
| fixed thresholds: | 350...400 | NONE |
| N_data plotted: | 13 |
| [click plot for closeup] |
Plot 2
scores: 2|
| | data source: | espresso_wave_thar_a
(QC1 database) |
| dataset: | fiba_thar_flux_ratio | • |
| median: | 1.05 | NONE |
| fixed thresholds: | 0.4...1.6 | NONE |
| N_data plotted: | 13 |
| [click plot for closeup] |
Plot 3
scores: 2|
| | data source: | espresso_wave_thar_b
(QC1 database) |
| dataset: | fibb_thar_lines_tot | • |
| median: | 406 | NONE |
| fixed thresholds: | 360...410 | NONE |
| N_data plotted: | 13 |
| [click plot for closeup] |
Plot 4
scores: 2|
| | data source: | espresso_wave_thar_b
(QC1 database) |
| dataset: | fibb_thar_flux_ratio | • |
| median: | 1.59 | NONE |
| fixed thresholds: | 0.4...1.6 | NONE |
| N_data plotted: | 13 |
| [click plot for closeup] |
Trending plots for ThAr wavelength-calibration exposures.
The plots show the total number of ThAr lines that are used for the wavelength calibrations
and the median flux ratio of these lines with respect to a reference line table.
General information
Click on any of the plots to see a close-up version.
The latest date is indicated on top of the plot.
If configured,
- data points belonging to the latest date are specially marked
- statistical averages are indicated by a solid line, and thresholds by broken lines
- outliers are marked by a red asterisk. They are defined as data points outside the
threshold lines
- "aliens" (= data points outside the plot Y limits) are marked by a red arrow (↑ or ↓)
- you can download the data for each parameter set if the 'Data downloads' link shows up
|
