Plot
? |
Symb
? |
Source
* |
Average ? |
Thresholds ? |
N_
data |
QC1
parameter |
Data
downloads |
Remarks |
| method |
value |
unit |
method |
value |
| 1 |
• | QC1DB |
none |
|
ADU |
VAL | 30000,55000 |
13 |
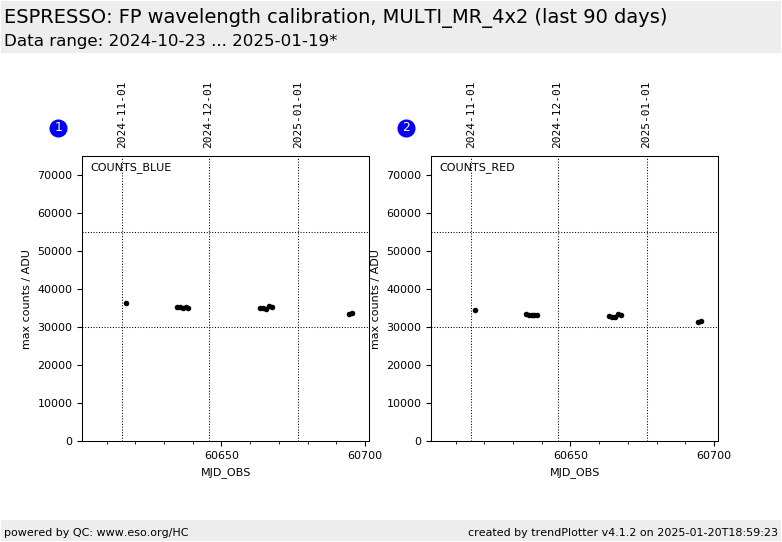
fiba_counts_max_blue |
this |
last_yr |
all
|
maximum number of counts on BLUE detector |
| 2 |
• | QC1DB |
none |
|
ADU |
VAL | 30000,55000 |
13 |
fiba_counts_max_red |
this |
last_yr |
all
|
maximum number of counts on RED detector |
| |
|
*Data sources: QC1DB: QC1 database; LOCAL: local data source
|
Plot 1
scores:  2| 2|
| | data source: | espresso_wave_fp
(QC1 database) |
| dataset: | fiba_counts_max_blue | • |
| average: | none |
| fixed thresholds: | 30000...55000 | ADU |
| N_data plotted: | 13 |
| [click plot for closeup] |
Plot 2
scores: 2|
| | data source: | espresso_wave_fp
(QC1 database) |
| dataset: | fiba_counts_max_red | • |
| average: | none |
| fixed thresholds: | 30000...55000 | ADU |
| N_data plotted: | 13 |
| [click plot for closeup] |
Trending plots for Fabry-Perot wavelength-calibration exposures.
The plot shows the maximum number of counts per detector.
General information
Click on any of the plots to see a close-up version.
The latest date is indicated on top of the plot.
If configured,
- data points belonging to the latest date are specially marked
- statistical averages are indicated by a solid line, and thresholds by broken lines
- outliers are marked by a red asterisk. They are defined as data points outside the
threshold lines
- "aliens" (= data points outside the plot Y limits) are marked by a red arrow (↑ or ↓)
- you can download the data for each parameter set if the 'Data downloads' link shows up
|
